Three months ago, I was looking into building coverage for eBPF programs.
That’s how bpfcov was born.
I did not want to reinvent the wheel, so I was looking into the existing coverage instrumentation features of LLVM.
Among the different options LLVM provides, source-based code coverage suddenly appeared very appealing to me.
It’s the most precise type of code coverage. In my opinion, the only one that gives its user a damn clue on what code region of the program is executing. It also helps understand why a particular code branch gets executed.
Using it is pretty straightforward. All resolve to the following steps:
- compile your C/C++ code with the
-fprofile-instr-generate -fcoverage-mappingClang options - run the program
- the execution of the program automatically creates a
default.profrawfileYou can set it to something else via theLLVM_PROFILE_FILEenvironment variable. - feed the
default.profrawfile to LLVM tools likellvm-profdataandllvm-cov
You now have a beautifully fine-grained coverage report for your C/C++ code.
But what caught my eye was feeling that this kind of coverage was not using debug info (like gcov does) at all, but it was using profiling data, coming directly from the darkest parts of LLVM.
My curiosity took me to some extraordinary places in the LLVM codebase…
I wanted to understand what the -fprofile-instr-generate was causing.
Also, I wanted to know how I got a binary file (default.profraw) without my code writing anything to the disk.
And what it contained.
Spoiler. It contains the globals that the -fprofile-instr-generate instruments into your code.
But we probably need to move one step at a time to learn something new.
-fprofile-instr-generate§
So, this is the dummy C code - hello.c - that I used to walk myself through this study.
#include <stdio.h>
#include <stdint.h>

void ciao()
{
    printf("ciao\n");
}

void foo()
{
    printf("foo\n");
}

int main(int argc, char **argv)
{
    if (argc > 1)
    {
        foo();
        for (int i = 0; i < 22; i++) {
            ciao();
        }
    }
    printf("main\n");
}
I compiled it to textual LLVM IR:
clang -g -fprofile-instr-generate -emit-llvm -S $< -o hello.ll
In a matter of milliseconds, I was able to look at its intermediate representation:
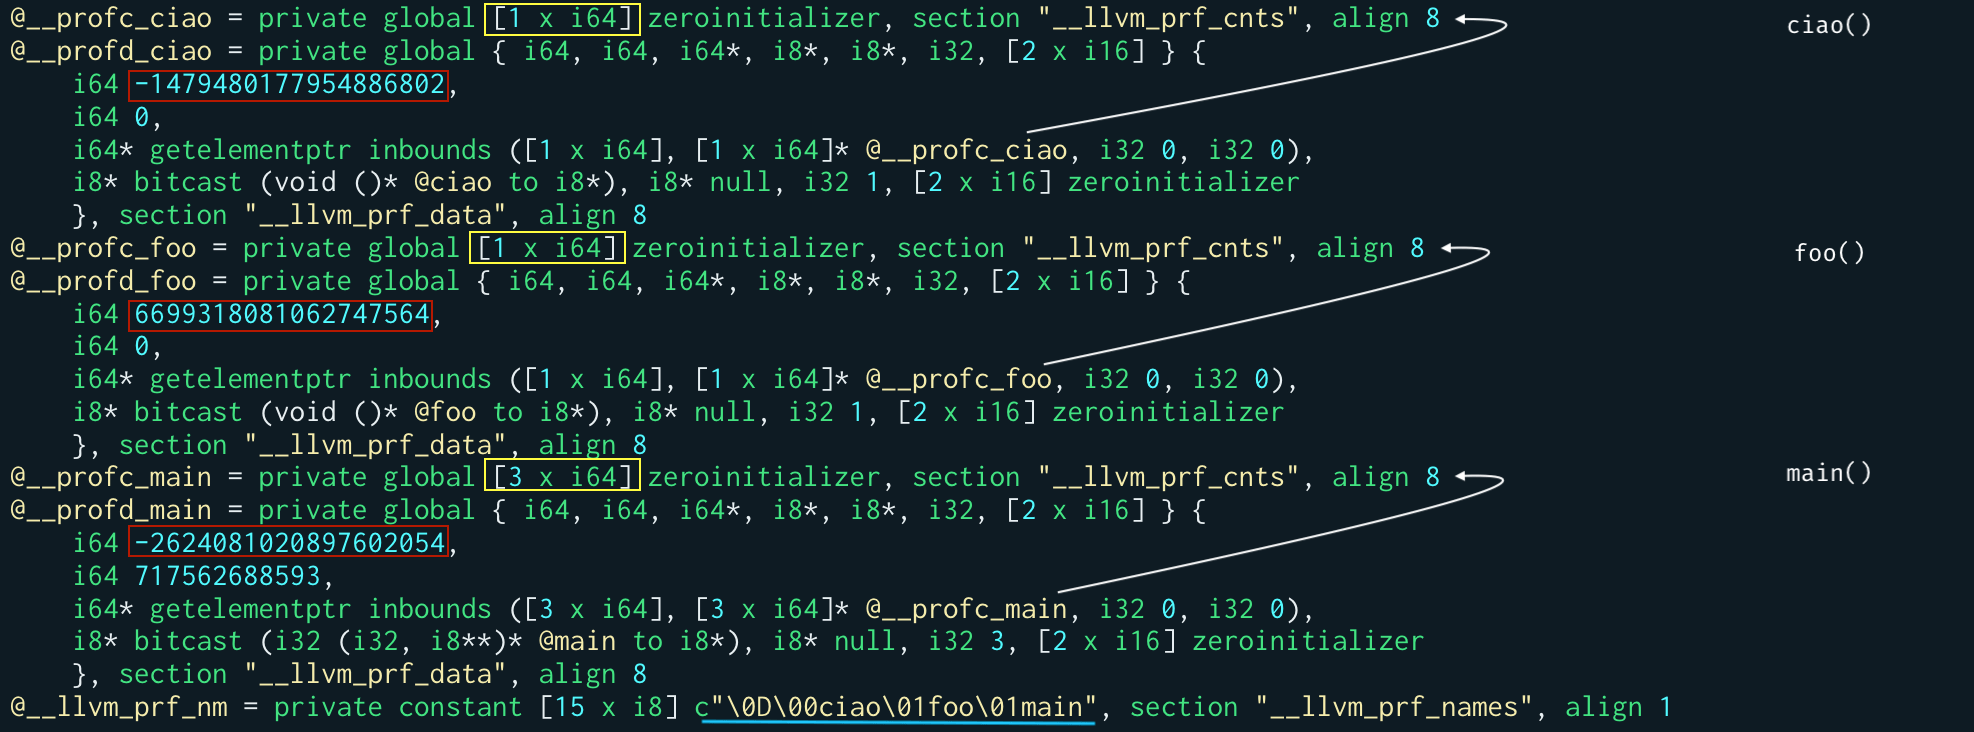
@__profc_ciao = private global [1 x i64] zeroinitializer, section "__llvm_prf_cnts", align 8
@__profd_ciao = private global { i64, i64, i64*, i8*, i8*, i32, [2 x i16] } { i64 -1479480177954886802, i64 0, i64* getelementptr inbounds ([1 x i64], [1 x i64]* @__profc_ciao, i32 0, i32 0), i8* bitcast (void ()* @ciao to i8*), i8* null, i32 1, [2 x i16] zeroinitializer }, section "__llvm_prf_data", align 8
@__profc_foo = private global [1 x i64] zeroinitializer, section "__llvm_prf_cnts", align 8
@__profd_foo = private global { i64, i64, i64*, i8*, i8*, i32, [2 x i16] } { i64 6699318081062747564, i64 0, i64* getelementptr inbounds ([1 x i64], [1 x i64]* @__profc_foo, i32 0, i32 0), i8* bitcast (void ()* @foo to i8*), i8* null, i32 1, [2 x i16] zeroinitializer }, section "__llvm_prf_data", align 8
@__profc_main = private global [3 x i64] zeroinitializer, section "__llvm_prf_cnts", align 8
@__profd_main = private global { i64, i64, i64*, i8*, i8*, i32, [2 x i16] } { i64 -2624081020897602054, i64 717562688593, i64* getelementptr inbounds ([3 x i64], [3 x i64]* @__profc_main, i32 0, i32 0), i8* bitcast (i32 (i32, i8**)* @main to i8*), i8* null, i32 3, [2 x i16] zeroinitializer }, section "__llvm_prf_data", align 8
@__llvm_prf_nm = private constant [23 x i8] c"\0D\15x\DAK\CEL\CCgL\CB\CFg\CCM\CC\CC\03\00\1Fy\04\88", section "__llvm_prf_names", align 1
It stands out from what we see that it contains:
Also, all these variables have ELF sections.
The __profc_<function_name> variables end up into the __llvm_prf_cnts section. The __profd_<function_name> variables end up into the __llvm_prf_data section. The __llvm_prf_nm variable ends up into the __llvm_prf_names section.
But what __profc_<function_name> variables are?
The section names helped me here: they are the counters used by LLVM for instrumenting our code for profiling!
Scrolling down into the LLVM IR, we see they’re getting incremented (load, add, store instructions sequence) at the correct spots:
define dso_local i32 @main(i32 %0, i8** %1) #0 !dbg !19 {
  ...
  %7 = load i64, i64* getelementptr inbounds ([3 x i64], [3 x i64]* @__profc_main, i64 0, i64 0), align 8, !dbg !30
  %8 = add i64 %7, 1, !dbg !30
  store i64 %8, i64* getelementptr inbounds ([3 x i64], [3 x i64]* @__profc_main, i64 0, i64 0), align 8, !dbg !30
  ...
  br i1 %10, label %11, label %24, !dbg !34

11:                                               ; preds = %2
  %12 = load i64, i64* getelementptr inbounds ([3 x i64], [3 x i64]* @__profc_main, i64 0, i64 1), align 8, !dbg !34
  %13 = add i64 %12, 1, !dbg !34
  store i64 %13, i64* getelementptr inbounds ([3 x i64], [3 x i64]* @__profc_main, i64 0, i64 1), align 8, !dbg !34
  call void @foo(), !dbg !35
  ...
  br label %14, !dbg !40

14:                                               ; preds = %20, %11
  %15 = load i32, i32* %6, align 4, !dbg !41
  %16 = icmp slt i32 %15, 22, !dbg !43
  br i1 %16, label %17, label %23, !dbg !44

17:                                               ; preds = %14
  %18 = load i64, i64* getelementptr inbounds ([3 x i64], [3 x i64]* @__profc_main, i64 0, i64 2), align 8, !dbg !44
  %19 = add i64 %18, 1, !dbg !44
  store i64 %19, i64* getelementptr inbounds ([3 x i64], [3 x i64]* @__profc_main, i64 0, i64 2), align 8, !dbg !44
  call void @ciao(), !dbg !45
  br label %20, !dbg !47

20:                                               ; preds = %17
  %21 = load i32, i32* %6, align 4, !dbg !48
  %22 = add nsw i32 %21, 1, !dbg !48
  store i32 %22, i32* %6, align 4, !dbg !48
  br label %14, !dbg !49, !llvm.loop !50

23:                                               ; preds = %14
  br label %24, !dbg !53

24:                                               ; preds = %23, %2
  %25 = call i32 (i8*, ...) @printf(i8* getelementptr inbounds ([6 x i8], [6 x i8]* @.str.2, i64 0, i64 0)), !dbg !54
  %26 = load i32, i32* %3, align 4, !dbg !55
  ret i32 %26, !dbg !55
}
We now know why the __profc_main array has size 3 (see [3 x i64]): LLVM instrumented one counter for the main() function’s entry, one for the if block, while the last one regards the for block.
We also know that we have a total of 5 counters, given the __profc_ciao and __profc_foo have both size 1.
Verifying this is just a matter of obtaining our program binary…
clang -g -fprofile-instr-generate hello.c -o hello
And playing with llvm-objdump:
llvm-objdump --section-headers hello | grep __llvm
# 17 __llvm_prf_names   00000017 0000000000008b89 DATA
# 26 __llvm_prf_cnts    00000028 000000000000c110 DATA
# 27 __llvm_prf_data    00000090 000000000000c138 DATA
llvm-objdump --syms hello | grep __llvm_prf_cnts
# 000000000000c110 g       __llvm_prf_cnts        0000000000000000 .hidden __start___llvm_prf_cnts
# 000000000000c138 g       __llvm_prf_cnts        0000000000000000 .hidden __stop___llvm_prf_cnts
The output here helps us confirm that we have 5 total counters of 8 bytes each, starting at address c110 and ending at c138.
In fact, $c138 - c110 = 28$, which means 40 bytes in decimal base (ie., $8 * 5$).
What about the __profd_<function_name> variables instead?
llvm-objdump --syms hello | grep __llvm_prf_data
# 000000000000c1c8 g       __llvm_prf_data        0000000000000000 .hidden __stop___llvm_prf_data
# 000000000000c138 g       __llvm_prf_data        0000000000000000 .hidden __start___llvm_prf_data
At the moment, all you need to know is that those are structs containing data about the function they refer to and the instrumented counters for it.
I hope the following image clarifies the relationship. Anyways, we’ll dig deeper into the __profd_<function_name> variables later.
Generating the profraw§
At this point, I still didn’t know how the default.profraw file got created every time I executed my binary.
I came back to the LLVM source code. It’s incredible the superpowers that reading the source gives you…
I found InstrProfilingFile.cSource..
Long story short: the code in this LLVM source file implements the profiling runtime initialization, which means it is responsible for gathering all the data from the variables (counters, data, etc.) we’ve seen and flushing them out in the default.profraw file.
While looking at it, I suddenly noticed the __llvm_profile_initializeSource. function.
It gets invoked by the profiling runtime initialization hook to get the filename of the profraw to create. Either from an environment variable (LLVM_PROFILE_FILE) or using the default one (default.profraw). Finally, it calls the C library function atexit(__llvm_profile_write_file). Which will cause the __llvm_profile_write_file function to be invoked when the program terminates.
Thus, I also noticed the __llvm_profile_write_fileSource. function.
The main thing this function does is to invoke writeFile(Filename)Source.. Which, in turn, calls lprofWriteData Source..
It’s again time to verify with llvm-objdump.
llvm-objdump --syms hello | grep __llvm_profile
# 0000000000004180 l     F .text  00000000000001a1 __llvm_profile_write_file
# 0000000000004610 g     F .text  0000000000000037 .hidden __llvm_profile_register_write_file_atexit
# 00000000000121e4 g     O .bss   0000000000000004 .hidden __llvm_profile_runtime
# 000000000000c108  w    O .data  0000000000000008 __llvm_profile_raw_version
# 00000000000122e8  w    O .bss   0000000000000001 __llvm_profile_filename
# 00000000000040a0 g     F .text  00000000000000ae .hidden __llvm_profile_initialize
# ...
Our ELF got flooded by __llvm_profile_* functions.
Seeing all those symbols in the ELF made me 100% sure this is how LLVM makes our binary open the default.profraw file as soon it executes. In this way, it also makes our program automatically dump the profile data when it terminates.
Coming back to the lprofWriteData function implementation (in the InstrProfilingWriter.c source file), we instead discover what it dumps into default.profraw. It’s while doing so that we understand what a profraw file contains.
Such a functionSource.:
- calculates the size of the data, counters, and names
- calculates the paddings needed before and after the counters section (
__llvm_prf_cnts) and after the names section (__llvm_prf_names) - initializes the header structure (more on it below)
- writes the header
- writes the binary IDs
- if
NT_GNU_BUILD_IDis defined, otherwise skips them
- if
- writes the data
- the
__profd_<function_name>globals
- the
- writes the padding bytes before the counters for page alignment
- writes the counters
- the content of the
__profc_<function_name>globals at program termination
- the content of the
- writes the padding bytes after the counters for page alignment
- writes the names
- the
__llvm_prf_nmvariable
- the
- writes the padding bytes after the names part
- the profraw format want its size to be a multiple of 8
- writes the value profiling data
- only in case it was enabled
All these moving parts are written using the ProfDataIOVec data structureSource..
So, we can finally assert what a profraw binary file is composed by:
The INSTR_PROF_RAW_HEADER macro at InstrProfData.inc defines the parts composing the header of the profraw file. Which are:
- the magic
- the version
- the size of binary IDs
- the size of the data section:
- it is equal to the number of
__profd_<function_name>global variables - the data part starts where
__start___llvm_prf_datais - the data part ends where
__stop___llvm_prf_datais - assuming 3
__profd_<function_name>global struct exists{i64, i64, i64*, i8*, i8*, i32, [2 x i16]}(48 bytes), the data section size is the difference between the__stop_(c1c8) and__start_addresses (c138), thus 90 in hexadecimal0x90 is 144 decimal, so $144 / 48 = 3$.
- it is equal to the number of
- the padding bytes before the counters sectionIt can also be 0 bytes.
- the size of the counters section
- it is equal to the number of
__profc_<function_name>global variables - the counters part starts where the (
__start_)__llvm_prf_cntsis - the counters part starts where the (
__stop_)__llvm_prf_cntsis - assuming 3
__profc_*global variables existsFor a total of 5 counters, 8 bytes each:[1 x i64],[1 x i64],[3 x i64], the counters section size is the difference between the__stop_(c138) and the__start_addresses (c110), thus 28 in hexadecimal0x28 is 40 decimal, so $40 / 8 = 5$ which is the total number of counters.
- it is equal to the number of
- the padding bytes after the counters sectionIt can also be 0 bytes.
- the size of the names section
- it is equal to the size of
__llvm_prf_nmglobal variable - the names part starts where the (
__start_)__llvm_prf_namesis - the names part starts where the (
__stop_)__llvm_prf_namesis
- it is equal to the size of
- the counters delta
- it is the difference between the address at which the counter section begins and the address at which the data section begins
- it is equal to the address of the first
__profc_<function_name>counter - the names delta
- the address at which the names section begins
IPVK_LastIt seems to be always 1.
With the following table I tried to summarize the header’s content:
| 00 01 02 03 04 05 06 07 | 08 09 0A 0B 0C 0D 0E 0F |
|---|---|
| magic | version |
| data size | padding before counters |
| counters size | padding after counters |
| names size | counters delta |
| names begin | value kind last |
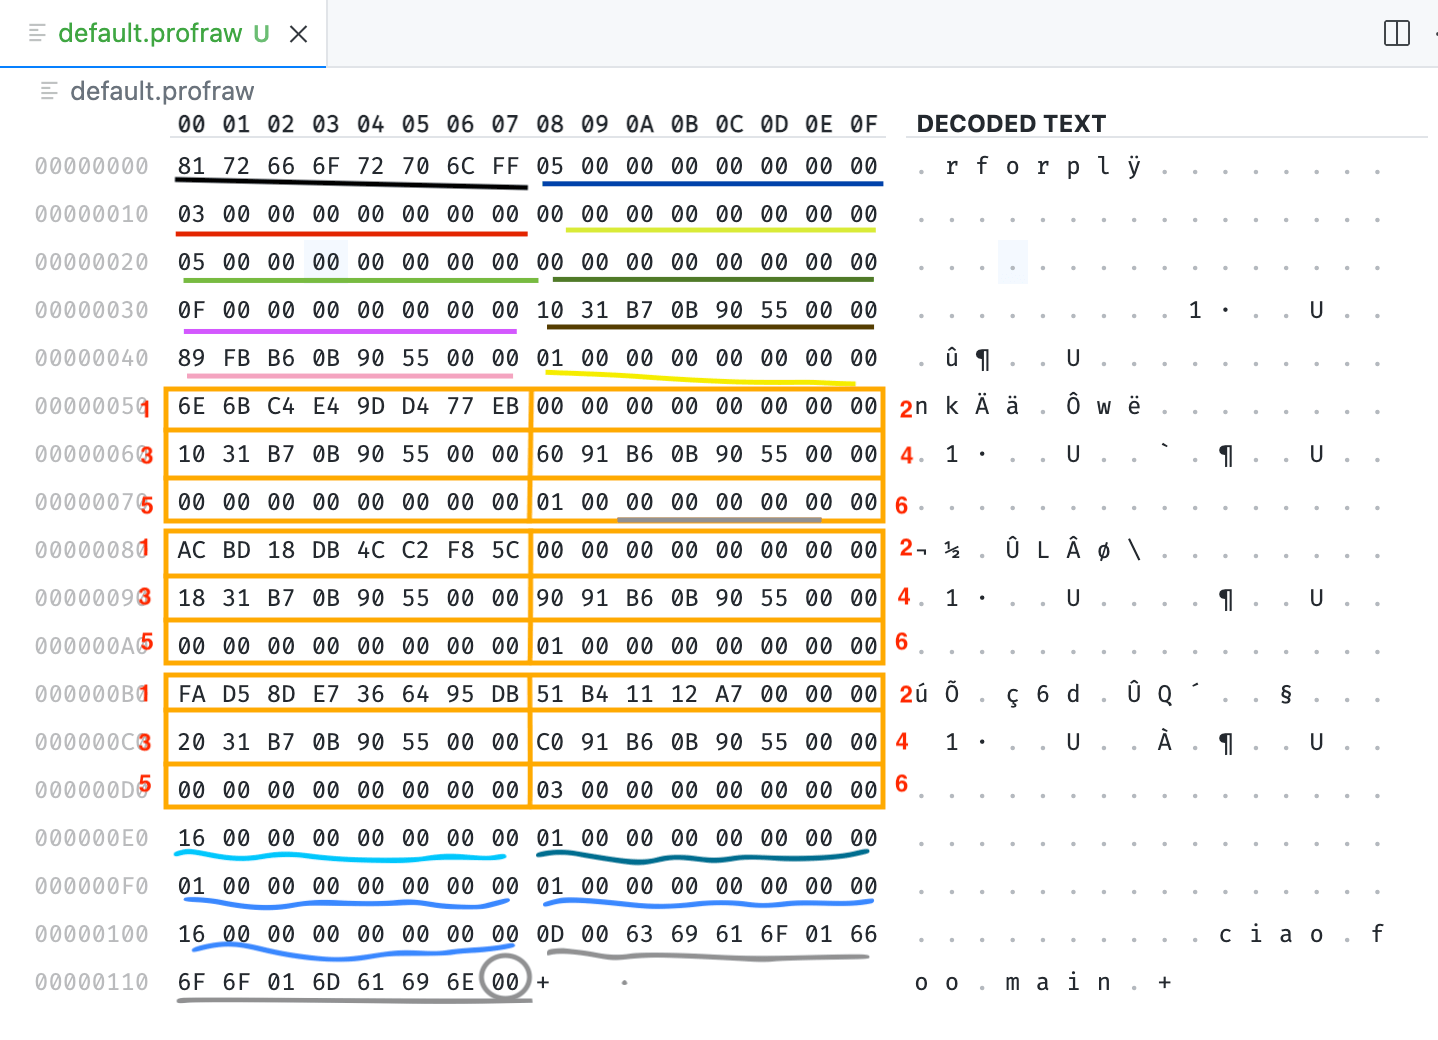
But probably an image is worth a thousand words.
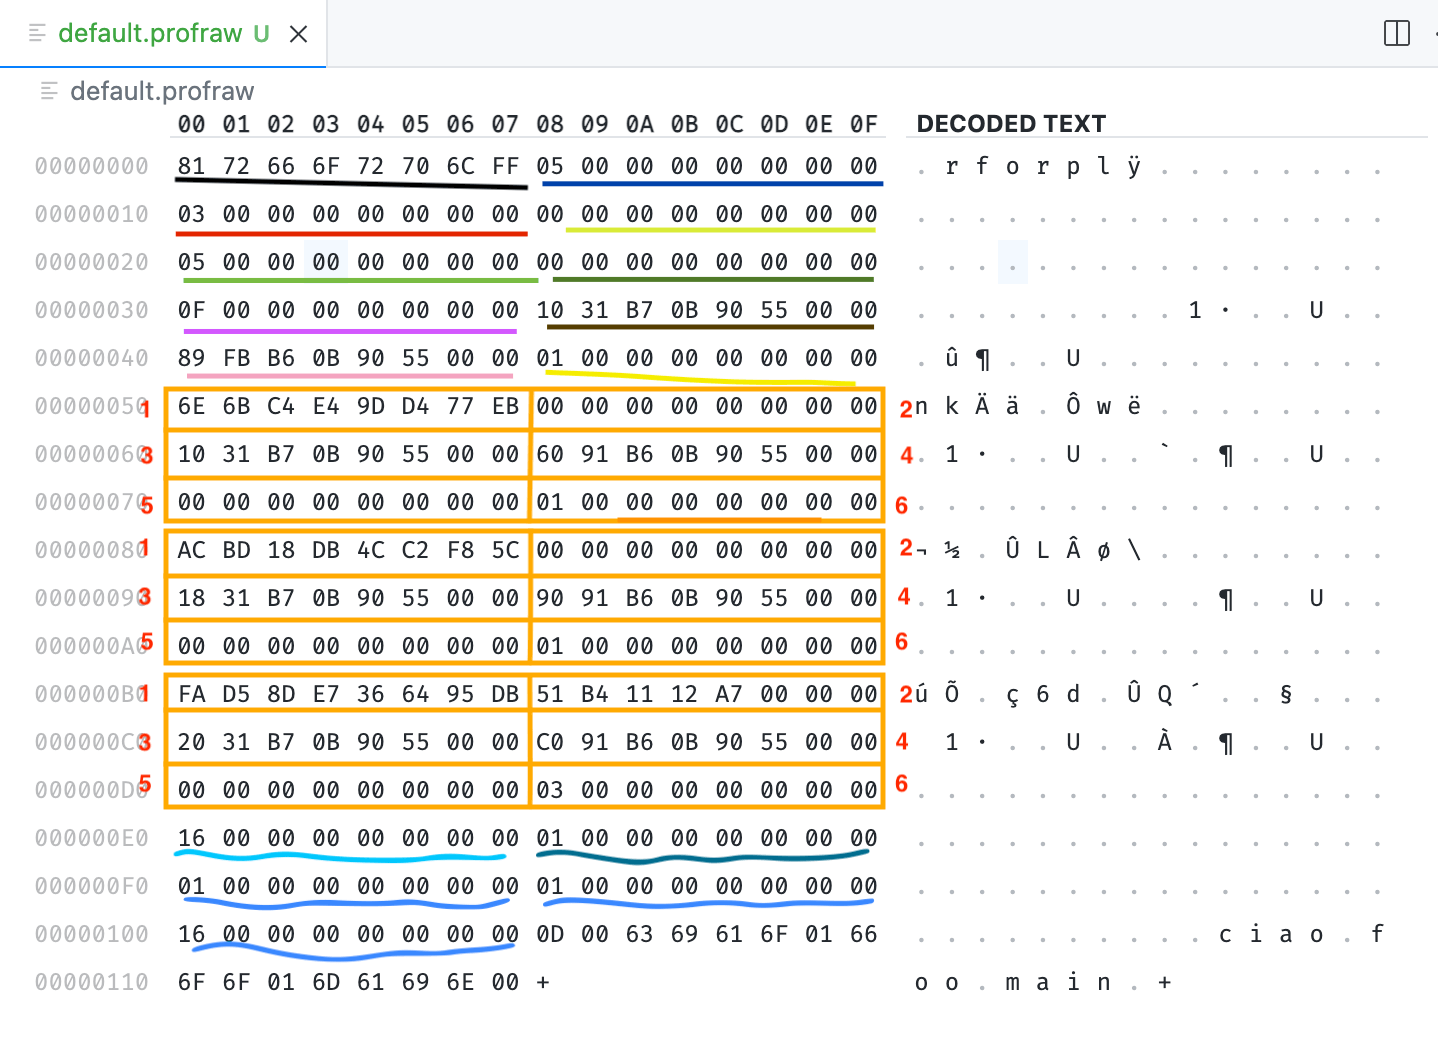
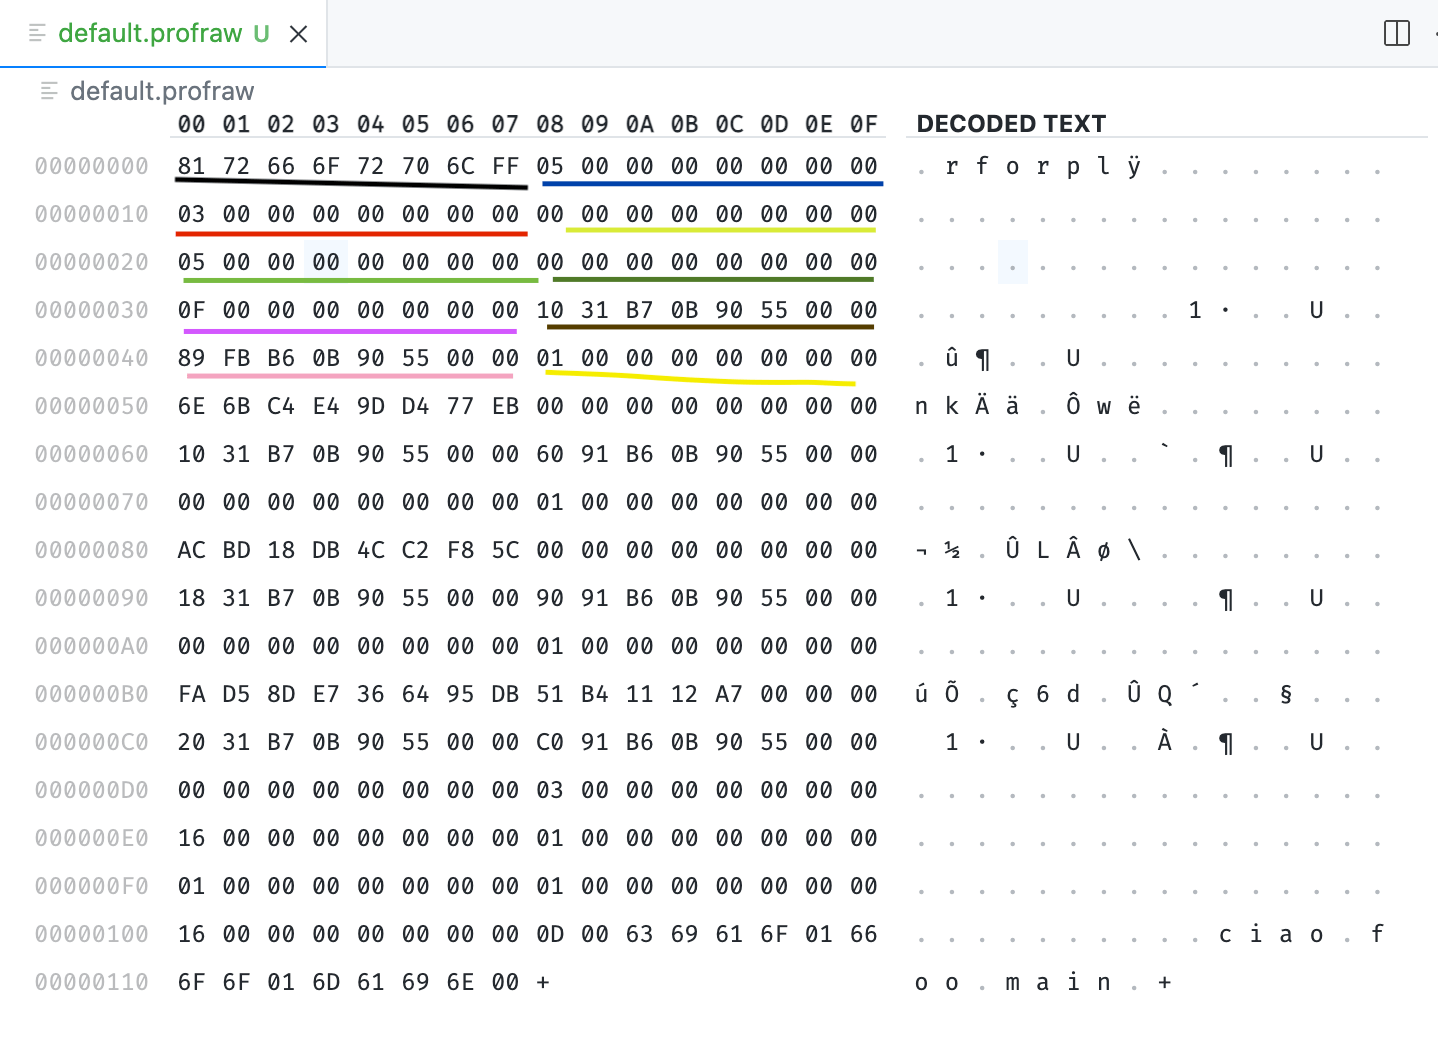
This is the default.profraw file after executing ./hello yay:
We can see that its header is composed of:
- the magic (in black)
- the version (in blue)
- the number of functions (in red)
- it equals to the number of
__profd_<function_name>variables too: 3
- it equals to the number of
- the padding bytes before the counters (in light green)
- the total number of the counters (in fluo green)
- meaning, the total size of
__profc_<function_name>variables: 5
- meaning, the total size of
- the padding bytes after the counters (in dark green)
- the length of the
__llvm_prf_nmvariable (in magenta): 0F in hex, 15 decimal - the address of the first counter (in brown)
- the address of
__llvm_prf_nm(in pink) IPVK_Last(1) in yellow
Exactly the way we were now expecting it.
Data§
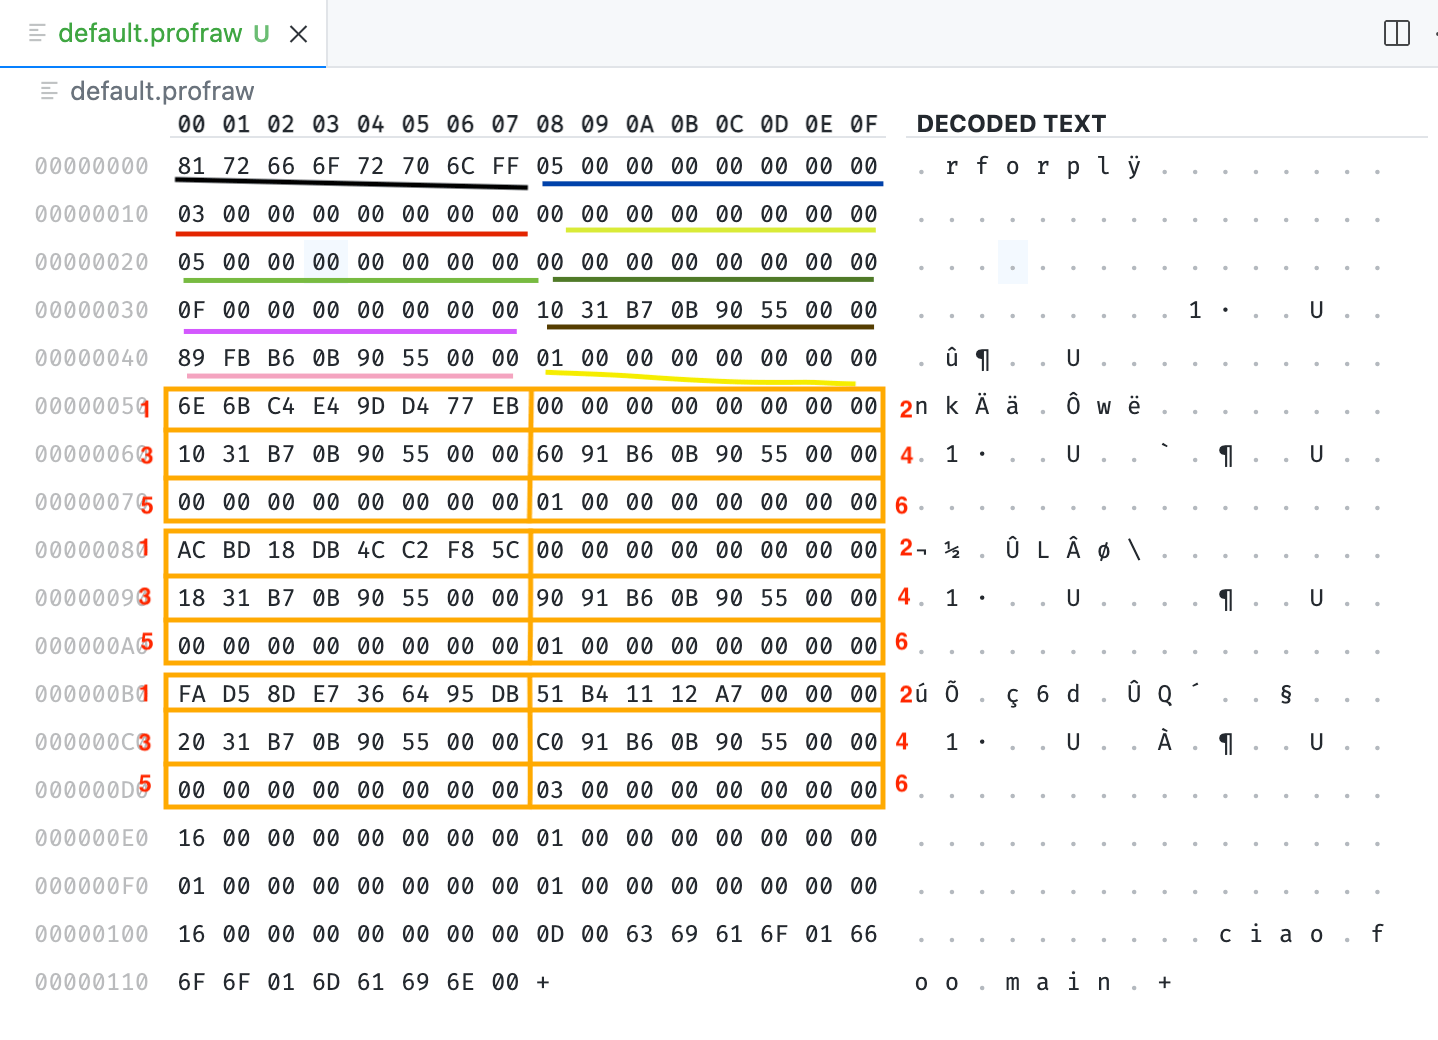
Focusing on the data part, I’ve highlighted with (orange) rectangles the 3 __profd_<function_name> global variables.
Each of the __profd_<function_name> contains 6 parts:
- 1 is the ID (hex, reverse order) of the function to which it refers
- 2 is the function control flow hash
- 3 points to the counter it relates to
- 4 points to the function it refers to
- 5 points to the value expressions, if any
- 6 contains the number of the counters (2 bytes) and the initialization array (number of value sites, 2 elements, 2 bytes each, often zero)
Counters§
After the data parte comes the counters part.
It just is a serialization of what the variables in the __llvm_prf_cnts ELF section contains.
In fact, in this screenshot you can see underlined (with waves, in shades of cyan/blue):
__profc_ciao: [1 x i64]- 1 counter, with value 16
- it means the
ciao()function was executed 22 (decimal) times
__profc_foo: [1 x i64]- 1 counter, with value 1
- it means the
foo()function only was executed 1 time
__profc_main: [3 x i64]- 3 counters, first two with value 1, last one with value 16
- it means the function
main()was executed 1 time, itsifconditional evaluated to true, and theforinside it got executed 22 (decimal) times
Names§
Finally, the __llvm_prf_nm variable populates the last part of the profraw file.
Here (in grey) you can see its contentFunction names are uncompressed because I compiled the binary with -mllvm -enable-name-compression=false flags., padded with a \0 byte (the one circled) at the end to align the profraw file size to be multiple of 8.
Usage§
It’s time to use the default.profraw file now:
llvm-profdata show --all-functions --counts default.profraw
# Counters:
#   ciao:
#     Hash: 0x0000000000000000
#     Counters: 1
#     Function count: 22
#     Block counts: []
#   foo:
#     Hash: 0x0000000000000000
#     Counters: 1
#     Function count: 1
#     Block counts: []
#   main:
#     Hash: 0x000000a71211b451
#     Counters: 3
#     Function count: 1
#     Block counts: [1, 22]
# Instrumentation level: Front-end
# Functions shown: 3
# Total functions: 3
# Maximum function count: 22
# Maximum internal block count: 22
Isn’t it cool?
There’s more you can do with profraw files and the LLVM toolchain, indeed. But showing that was not the goal of this post.
I hope you now have a better understanding of what profraw files are.
from Hacker News https://ift.tt/heCIRcu
No comments:
Post a Comment
Note: Only a member of this blog may post a comment.