I have another -ometer! This one is a spectrometer, allowing me to view the visible spectrum of light, and, importantly, to create charts of what, exactly, various light sources are doing in how they emit light. That, once done, allows me to make some cantankerous observations about the nature of our modern light sources. But, before getting there, spectrometers!
What’s a Spectrometer?
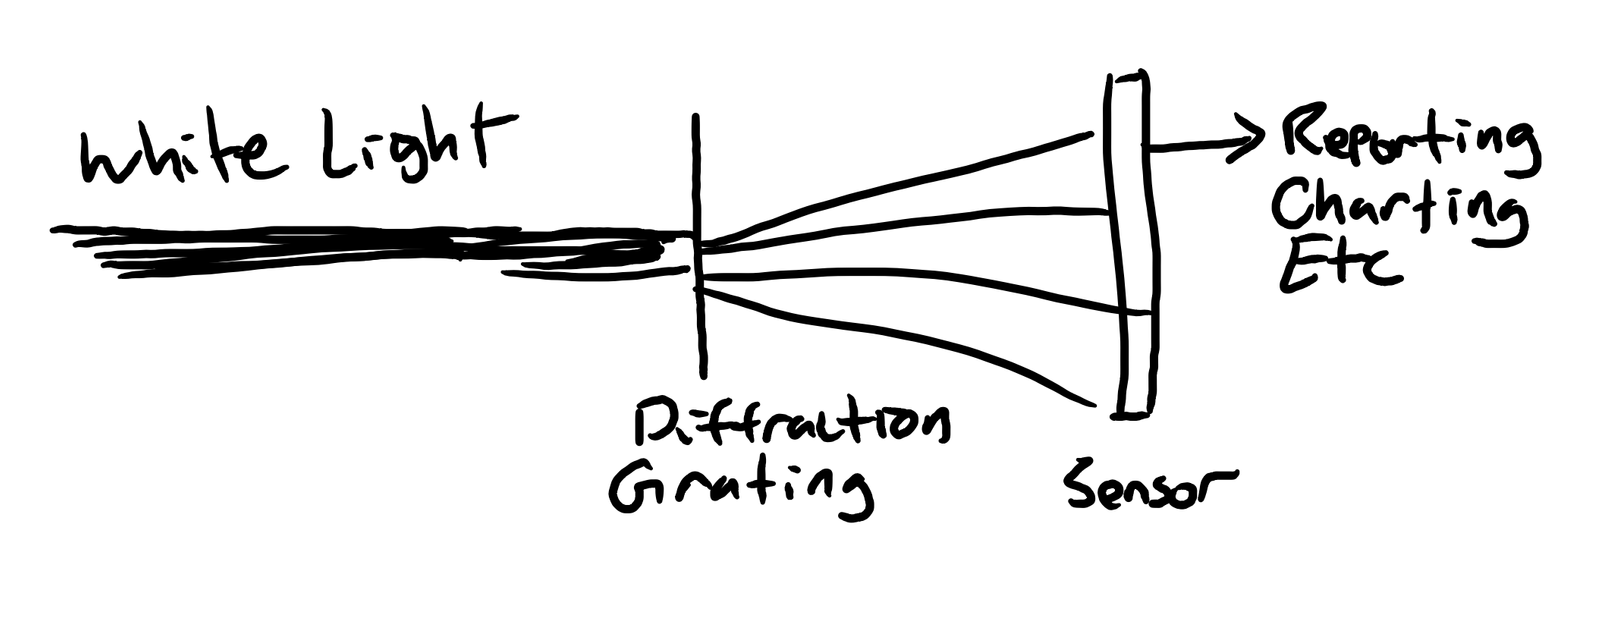
A spectrometer is simply a device that splits an incoming light beam by wavelength (like a rainbow), and then detects the intensity of the photons at each point along it. You can do it with a prism, with a diffraction grating, or probably with a range of other solutions, but the end result is something that allows you to measure the spectrum of some light source (possibly minus the stuff it’s gone through), and chart the results!
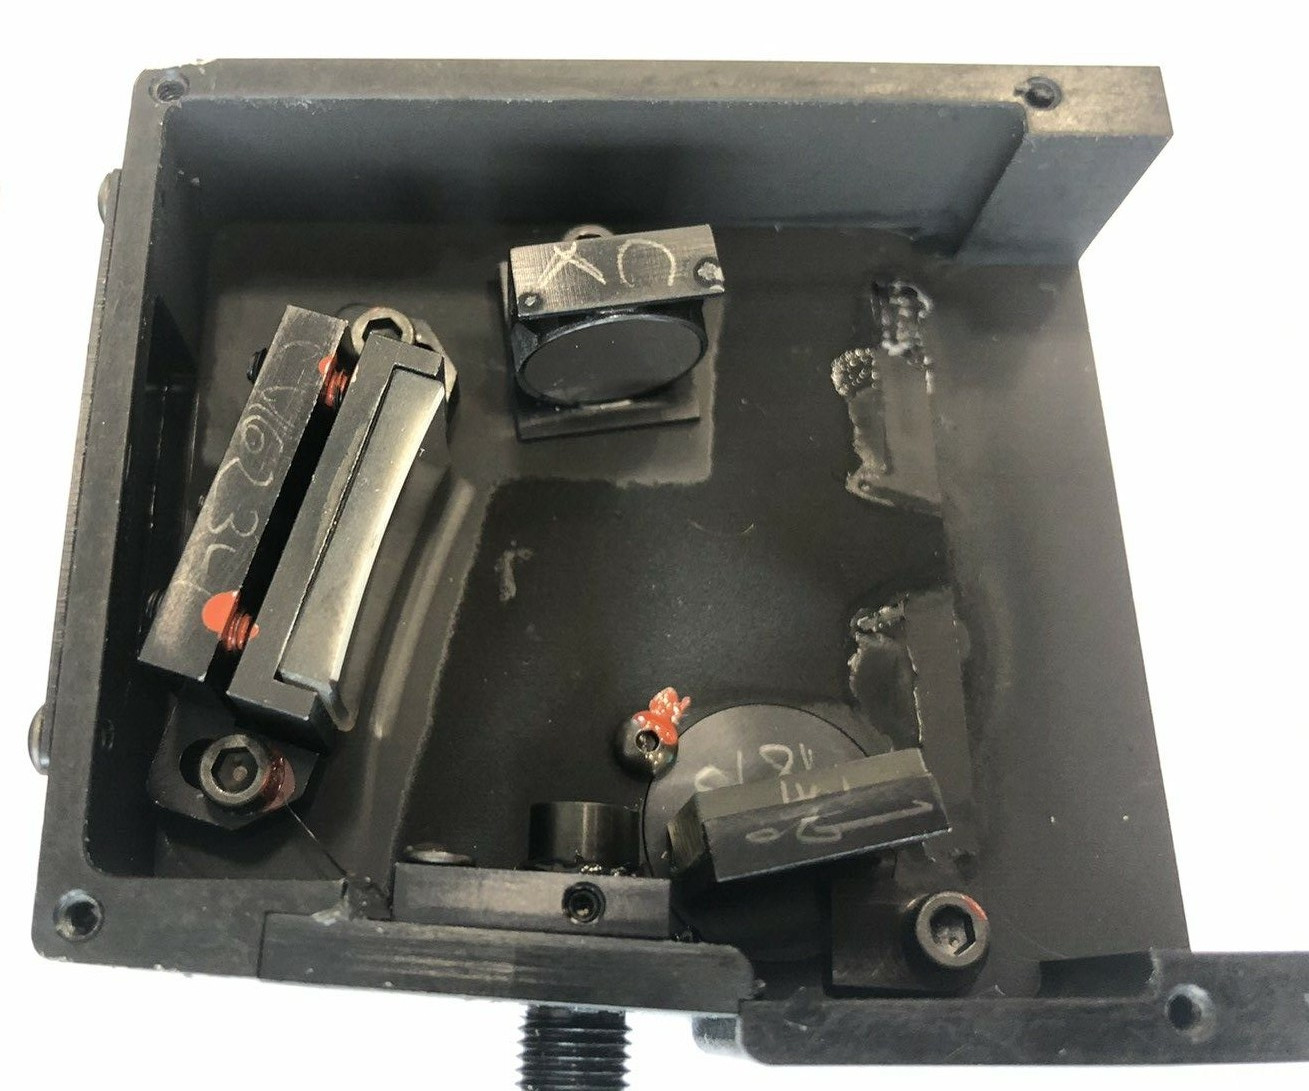
If you want to see the actual optical bench of my unit, it looks a bit more like this - there are mirrors and a reflection path from the slit (bottom) to the sensor (would go on the right).
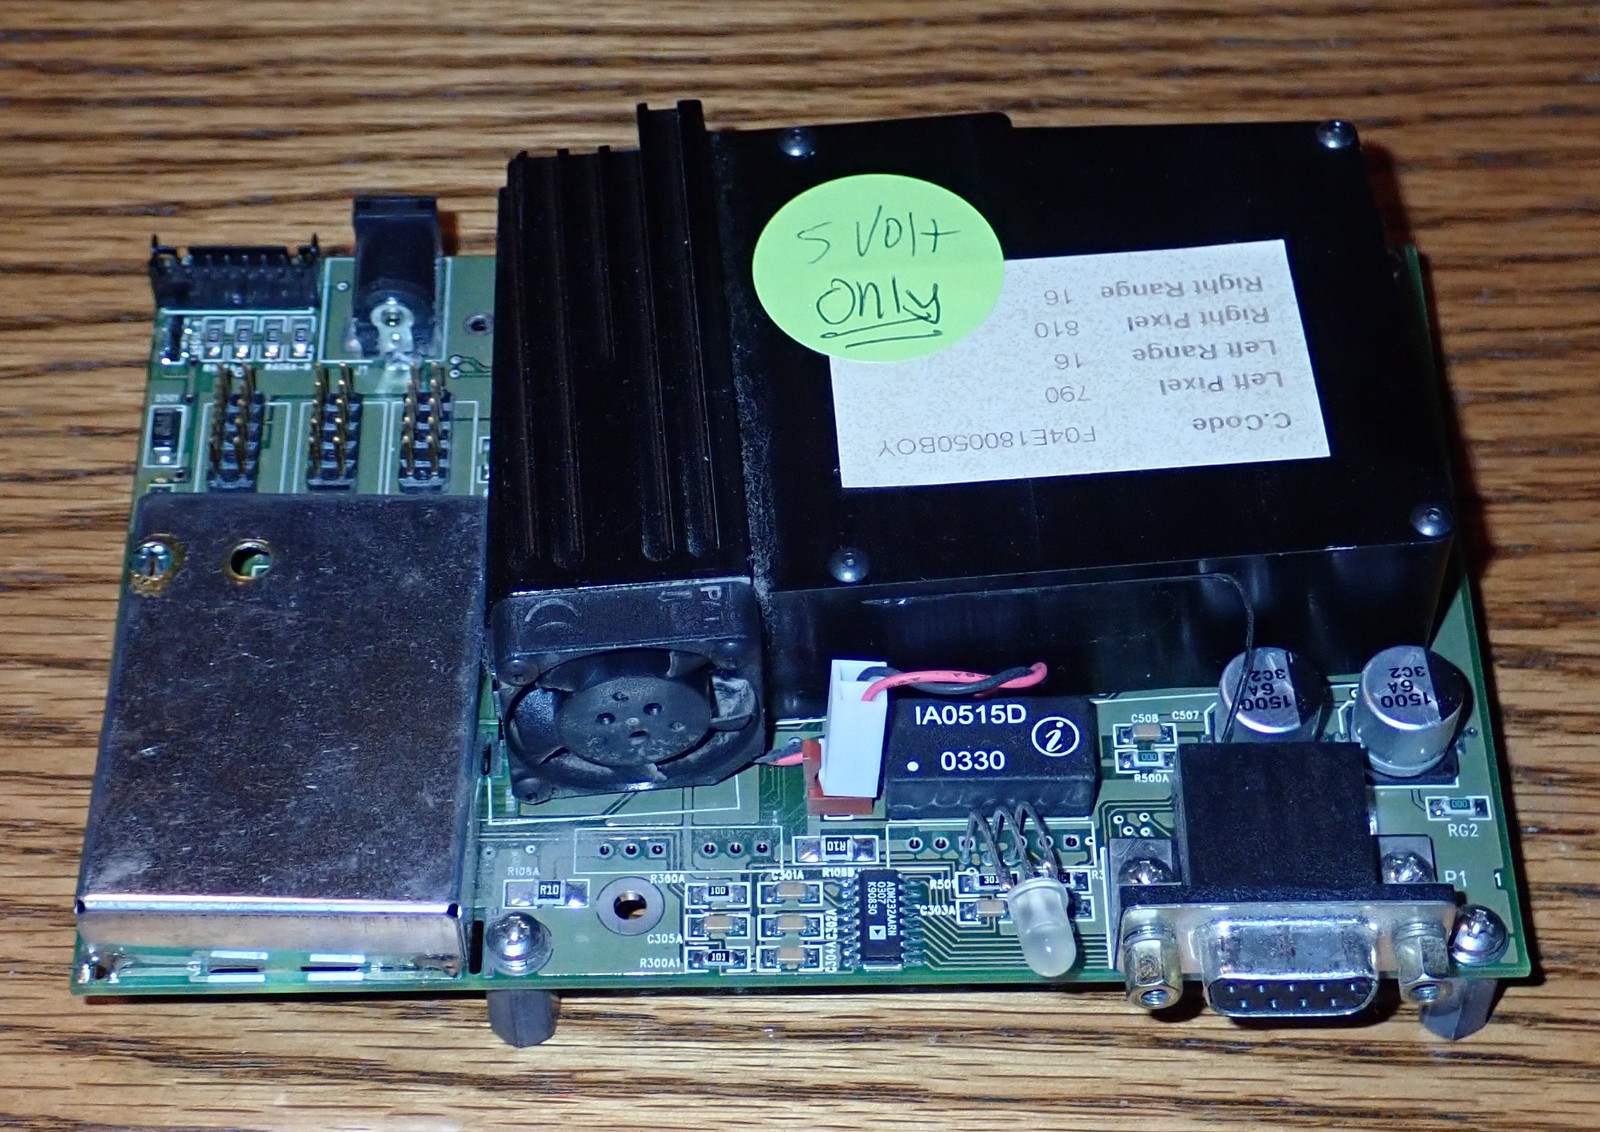
The B&W Tek BTC100-2S
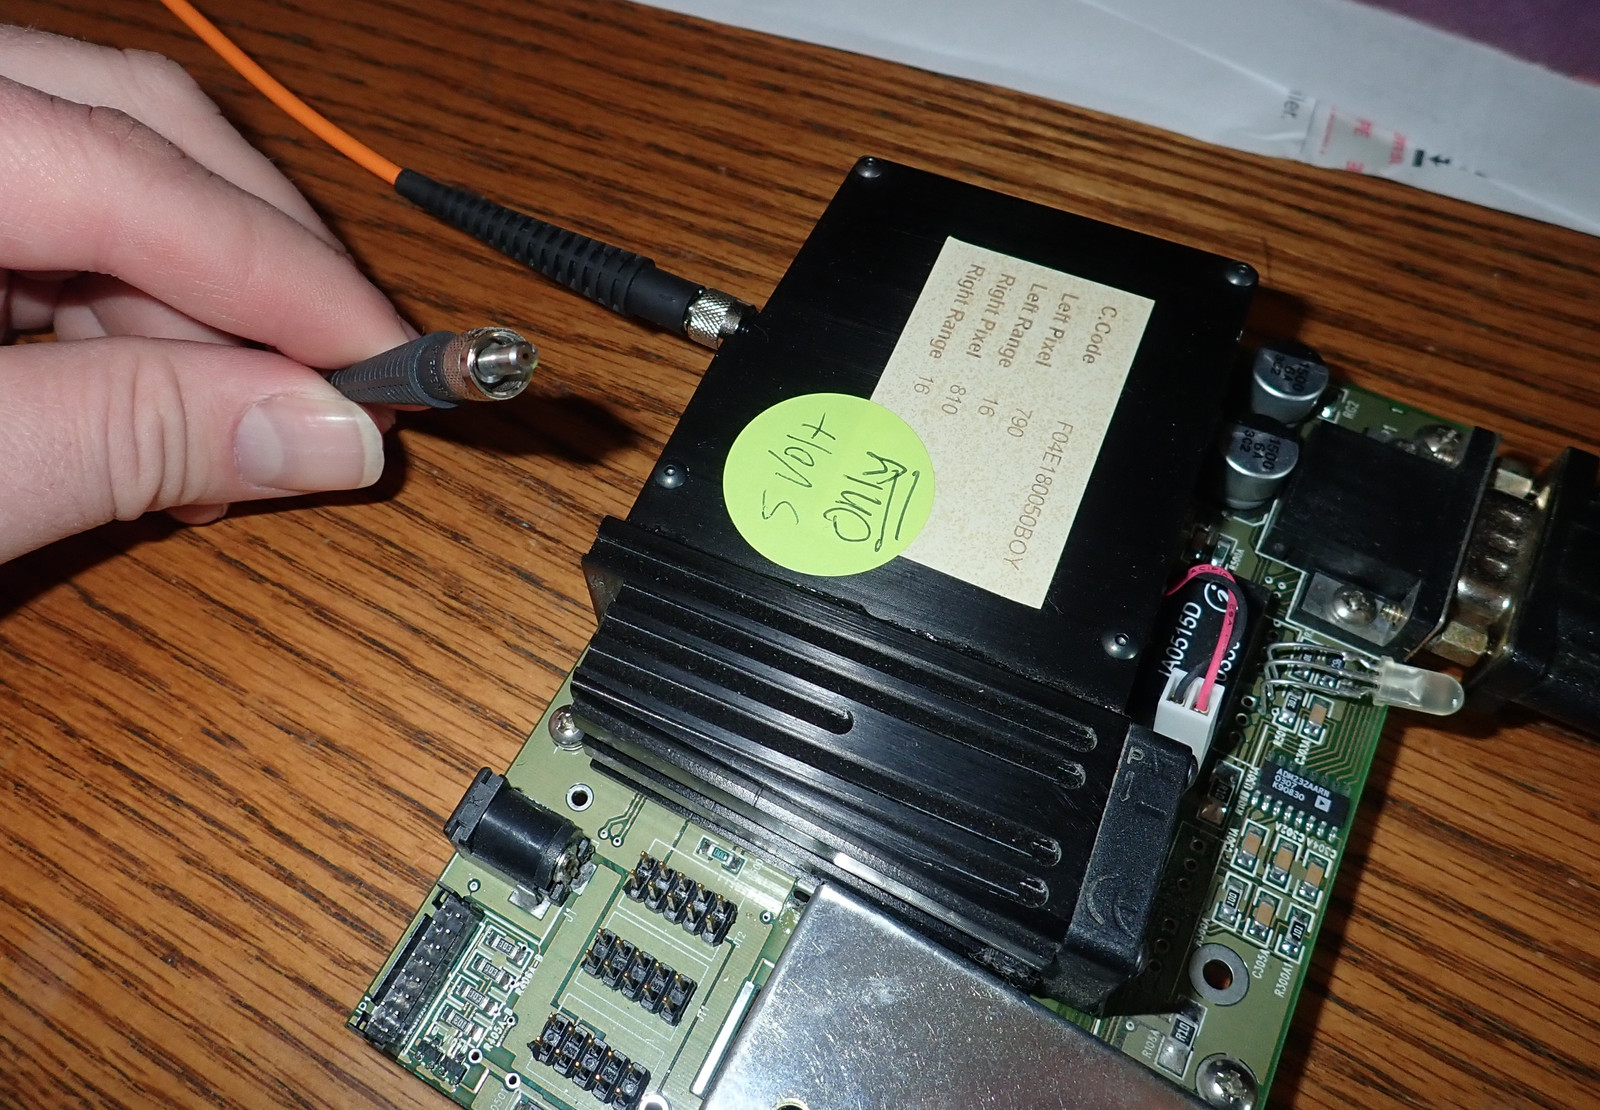
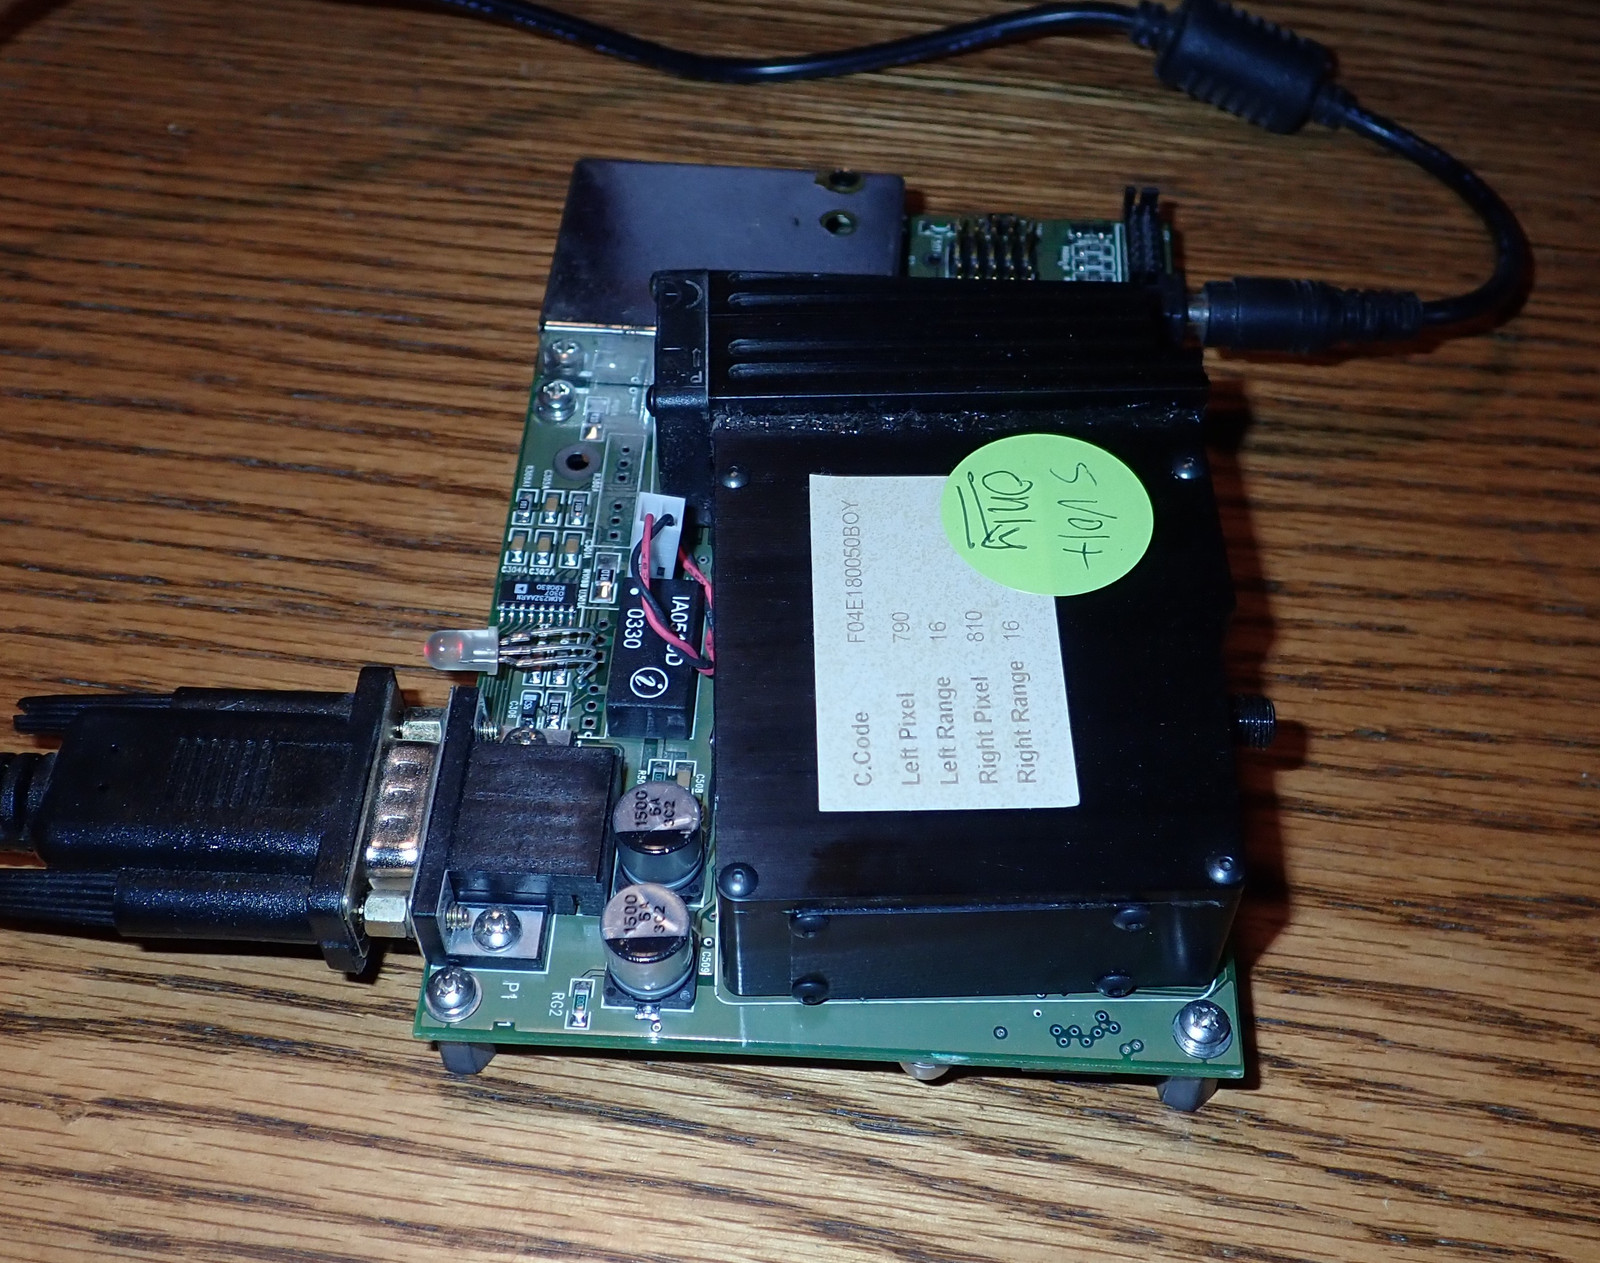
I got my spectrometer on eBay, from someone who clearly has a supply of these things and is parting them out in all the various forms. I have a complete unit, complete with working RS232 serial port that I use to talk to the thing! The sticker indicates 5V only, so… you know, don’t attach a 12V PSU to the barrel plug on it.
While I know it will pain some people, I’m not doing a full teardown on this unit - I intend to use it, and I can get photos of the various other interesting bits and pieces from elsewhere anyway. My goal here is useful spectrometry.
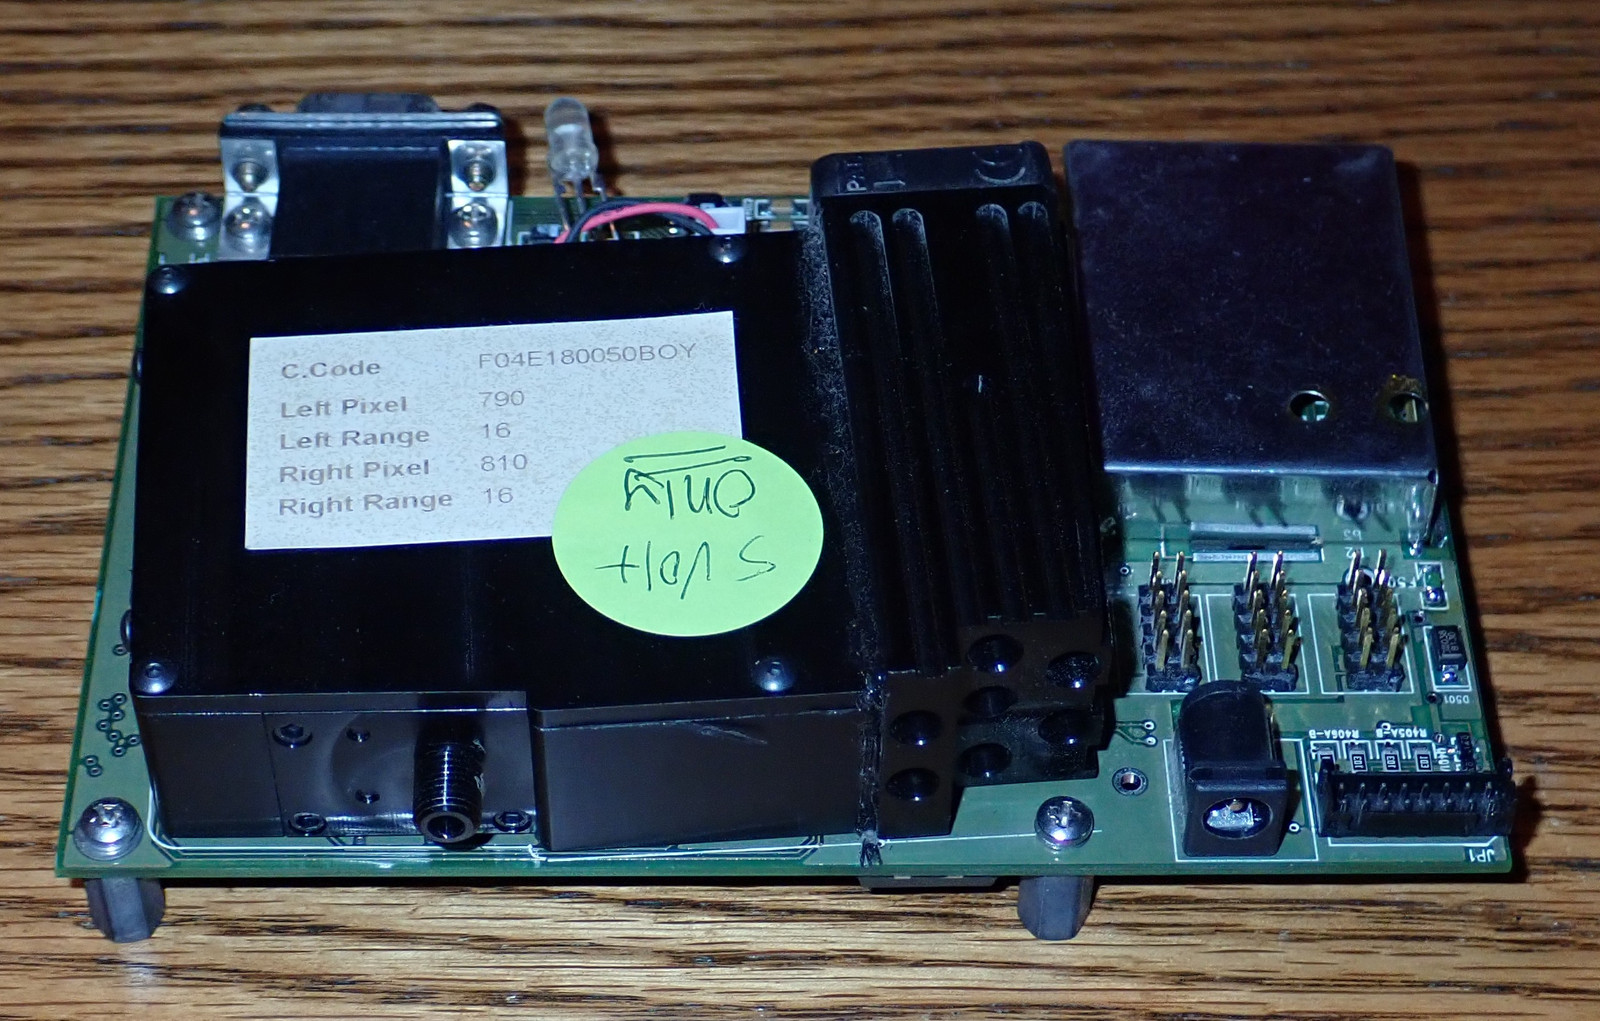
Spectrometers are simple enough: You let light in through a very narrow slit, bounce it off (or run it through) a diffraction grating (or prism, if you want) to spread it out into the spectrum of colors, and then measure how much intensity each color has. Graph this, calibrate, and you have a spectrometer! On this unit, all the optical function is handled in the black box on the top right, going into some variety of sensor on the left side (which is cooled by the fan - the FAQ claims that a BTC unit prefix means TE cooled). The status LED will glow red when the unit is booted, and the RS232 port provides for serial communications!
The other side has the input for the light (it’s a SMA905 fiber terminal, though you can get good results just pointing it at a light with no fiber), and the power jack - a normal barrel plug works there. I’ve no idea what the other connections here are - I can’t find documentation on this unit floating around the internet, so if you happen to know details, it would be nice to share!
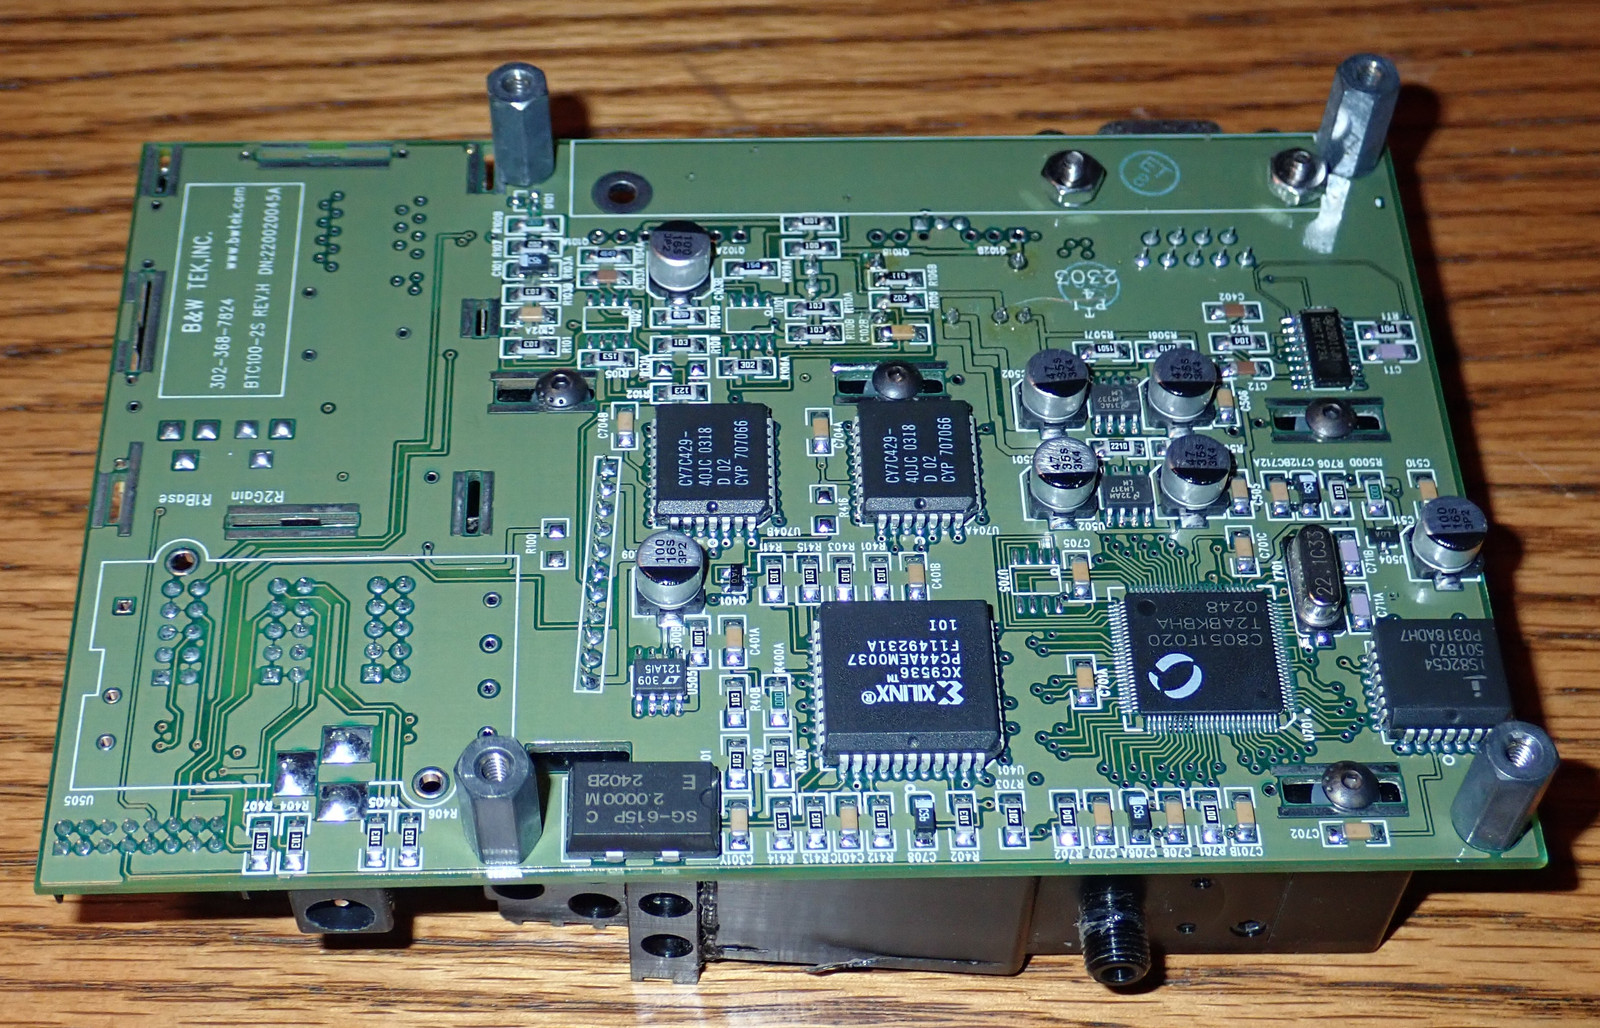
The underside contains the main circuitry, as well as the diagonal mount for the light sensor. I believe this is the core spectrometer out of a bigger lab unit that would have included light sources and other useful things, but as a standalone unit, this seems to work just fine!
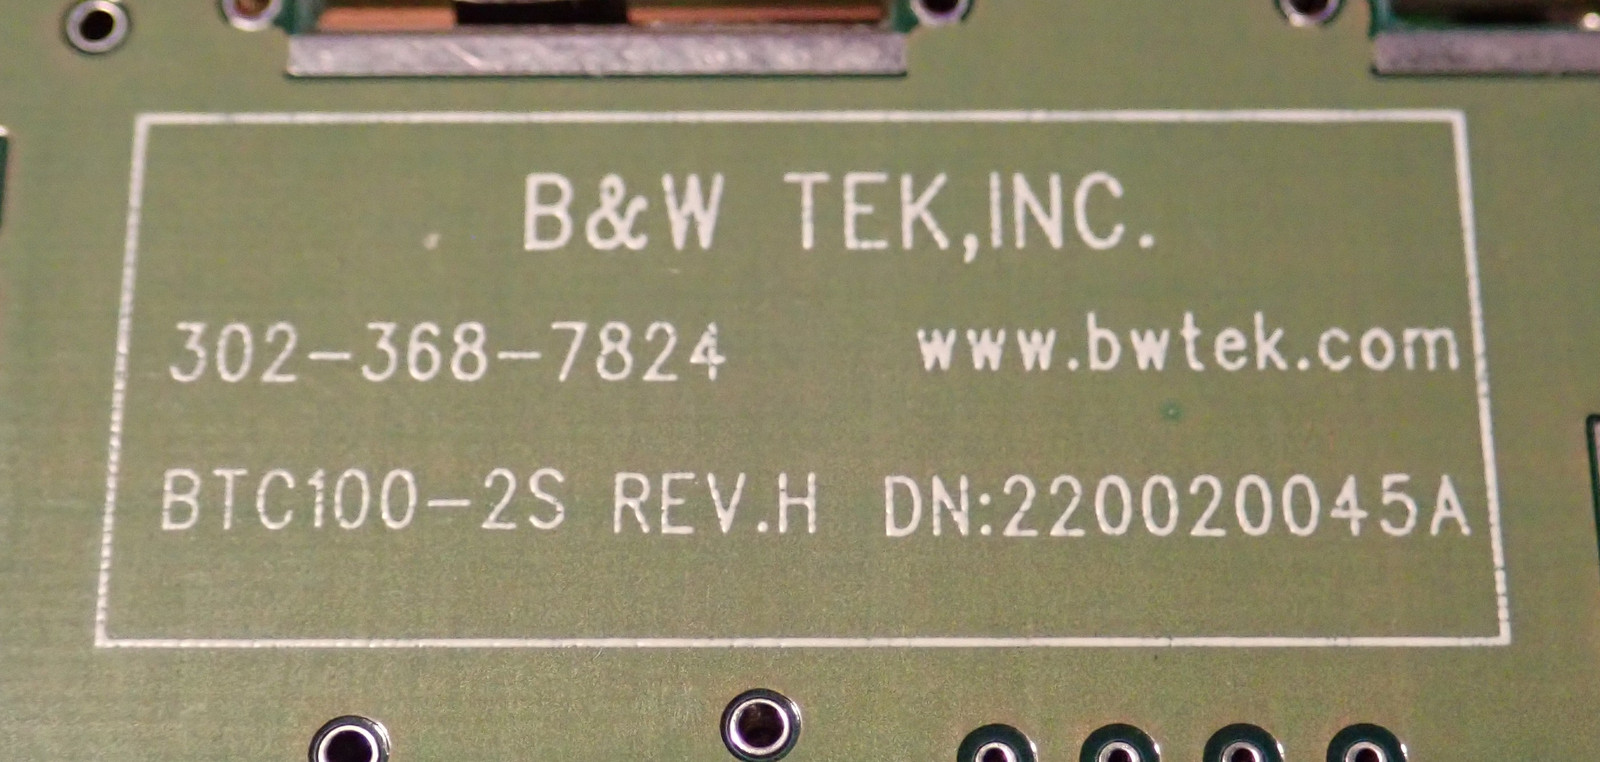
I like the old style product information fields. That’s a phone number starting in 302, not a model number, if you’re curious.
Flipping it over, there are some pieces I don’t normally see - so, of course, it’s time to look up the datasheets!
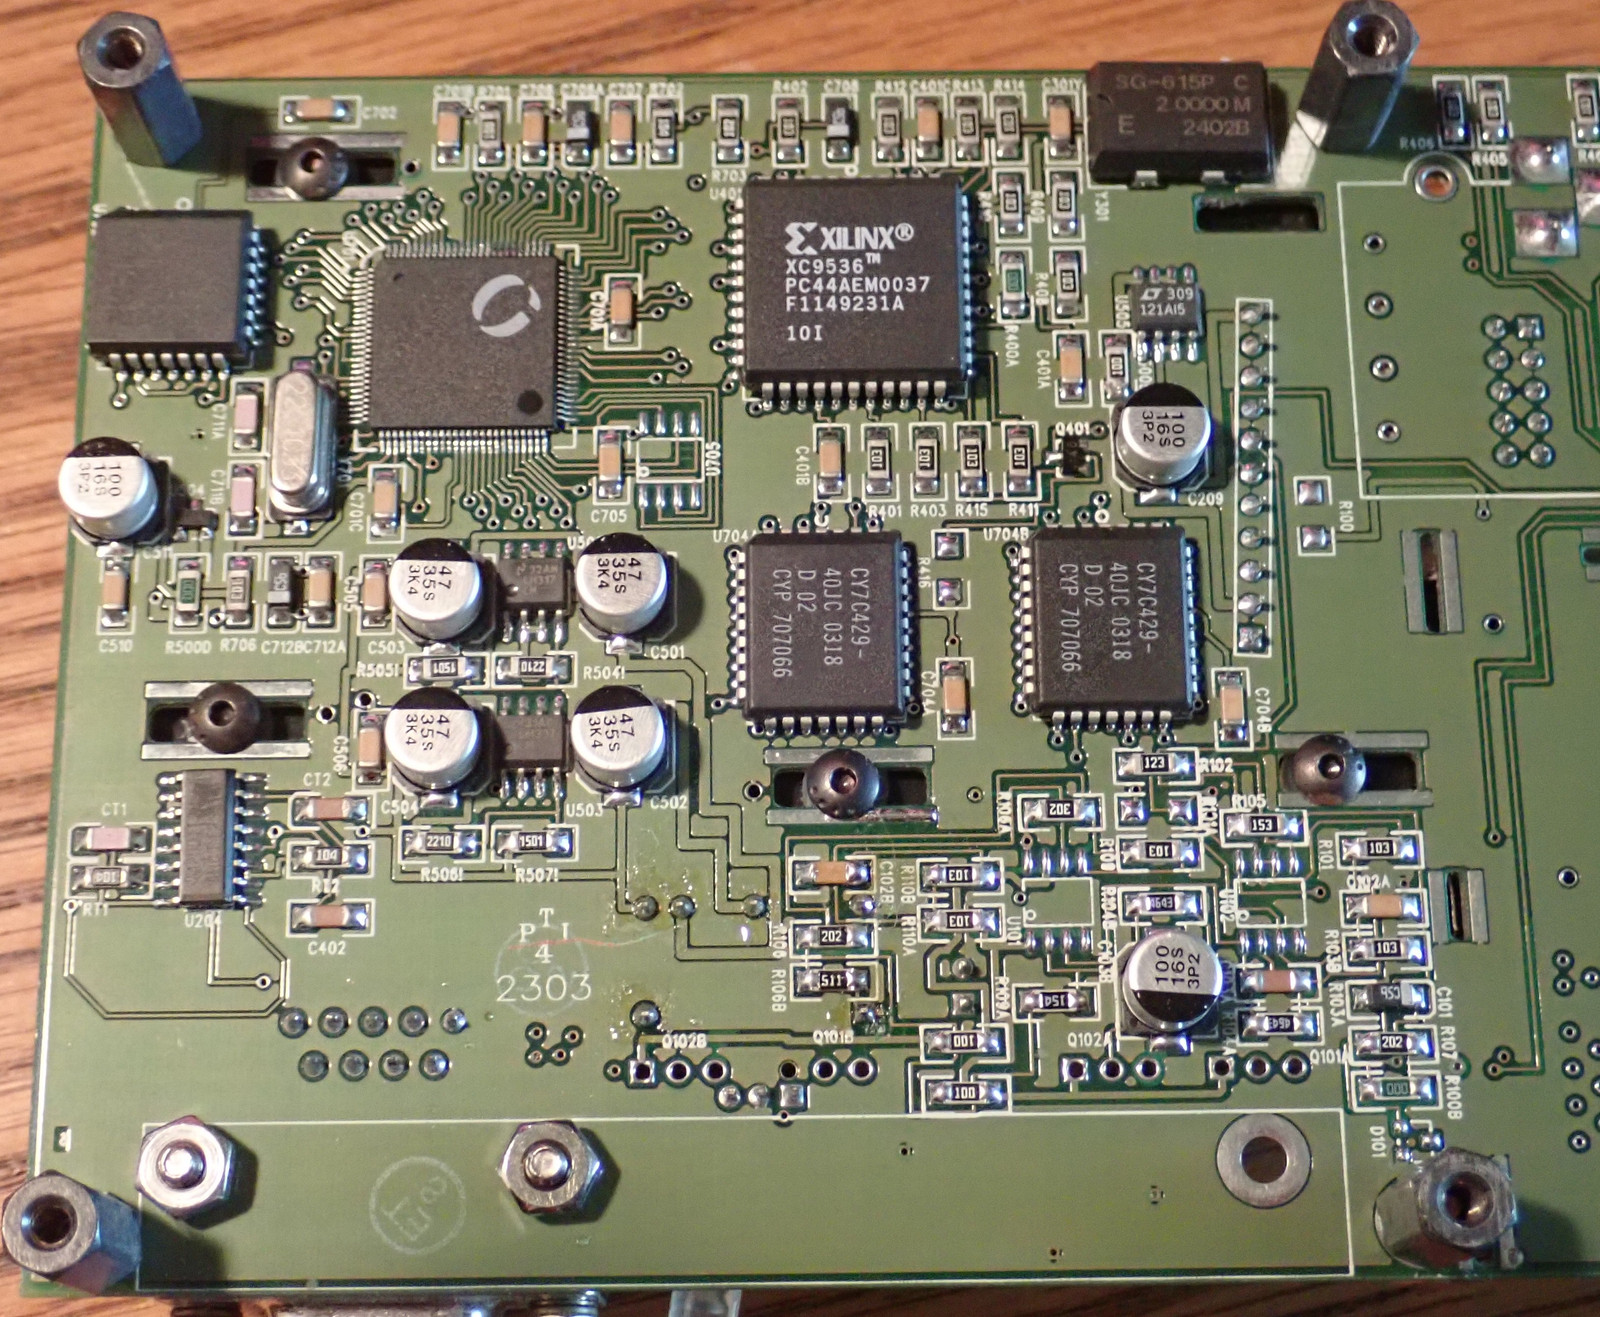
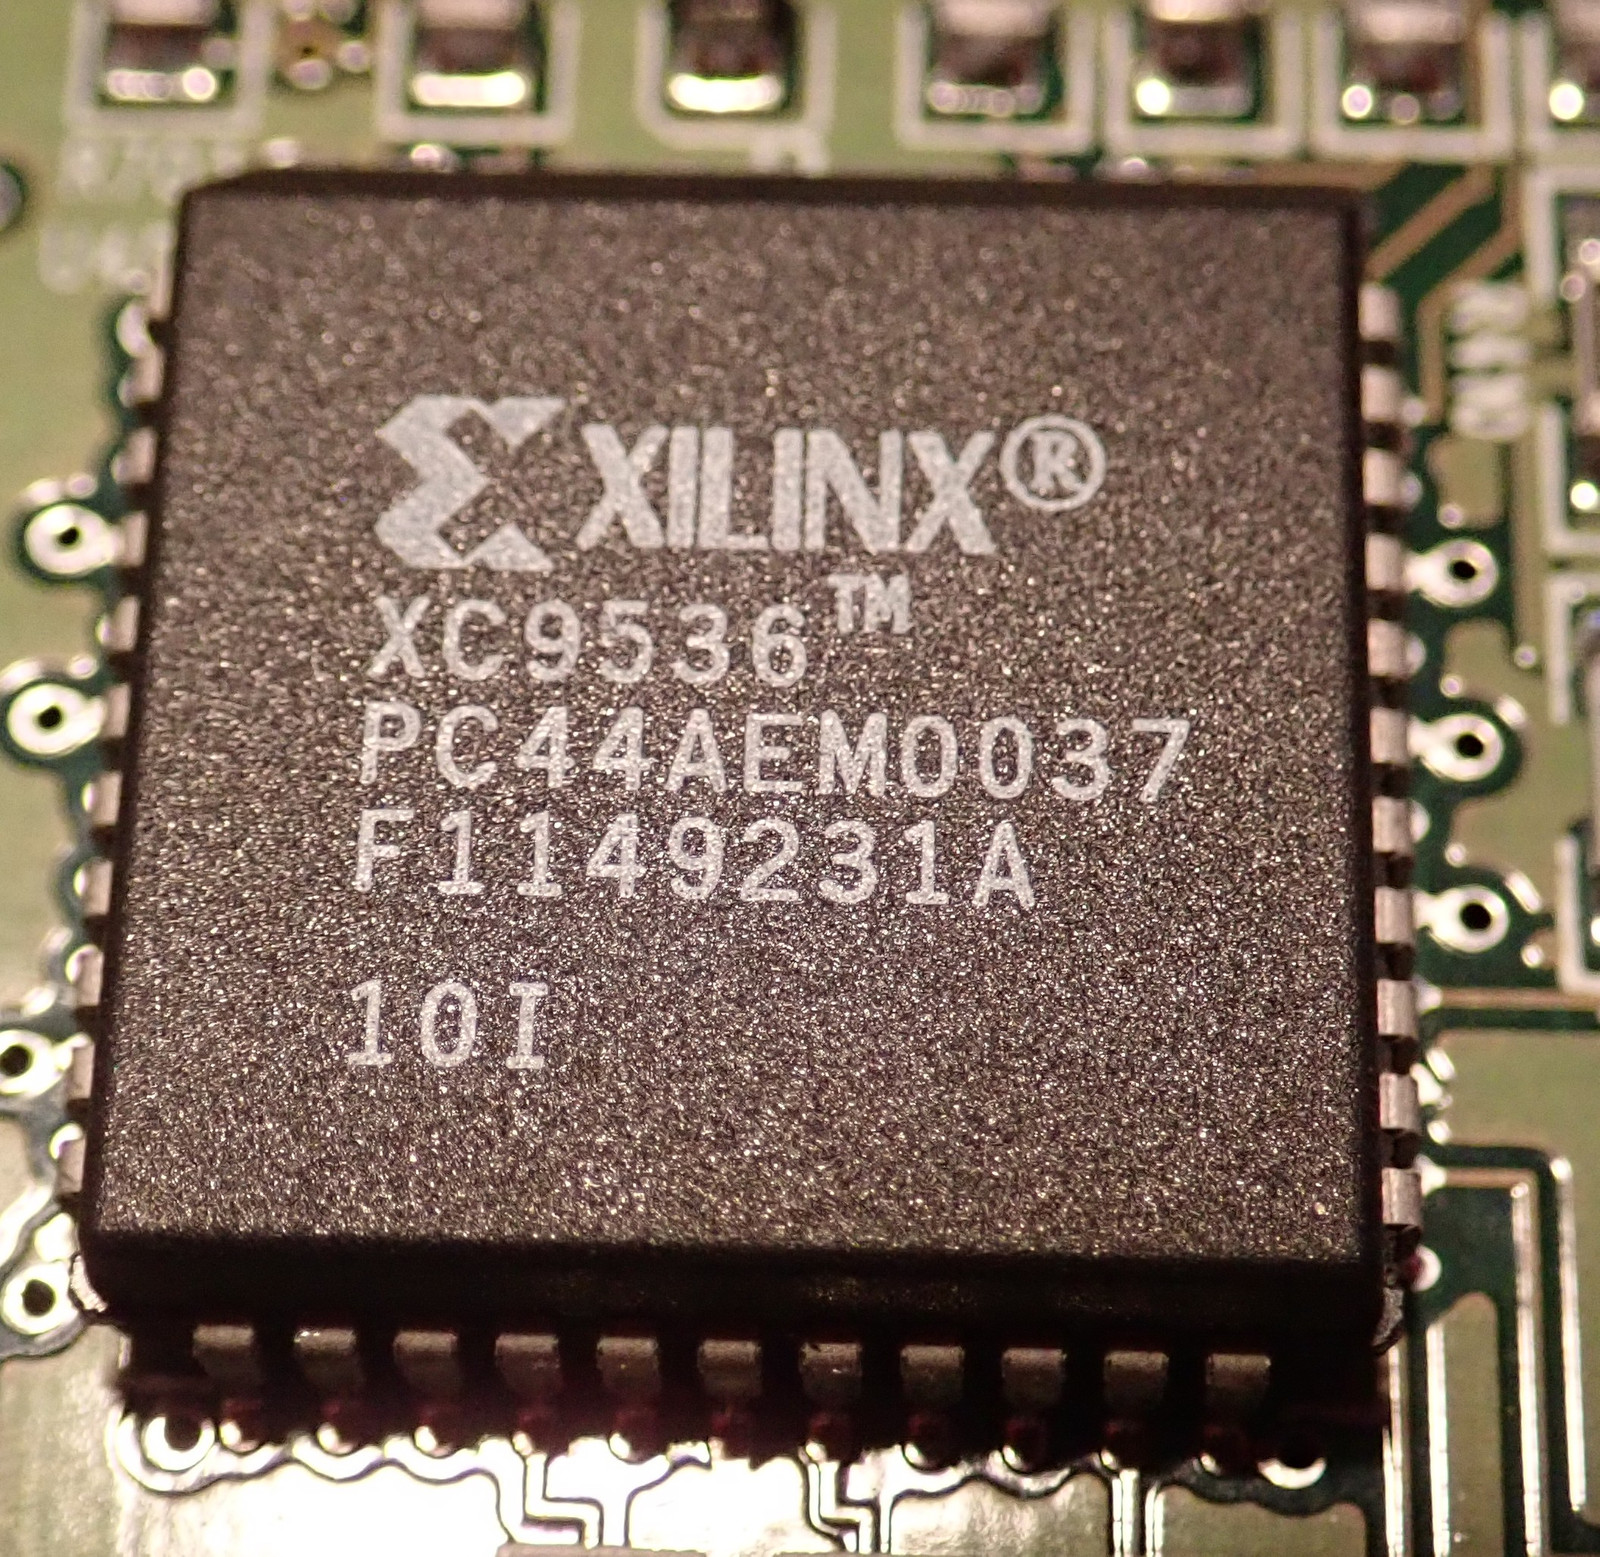
The Xilinx XC9536 is, to quote the datasheet, “a high-performance CPLD providing advanced in-system programming and test capabilities for general purpose logic integration. It is comprised of eight 36V18 Function Blocks, providing 800 usable gates with propagation delays of 5 ns.” These are just a quick responding logic device, useful for a variety of things.
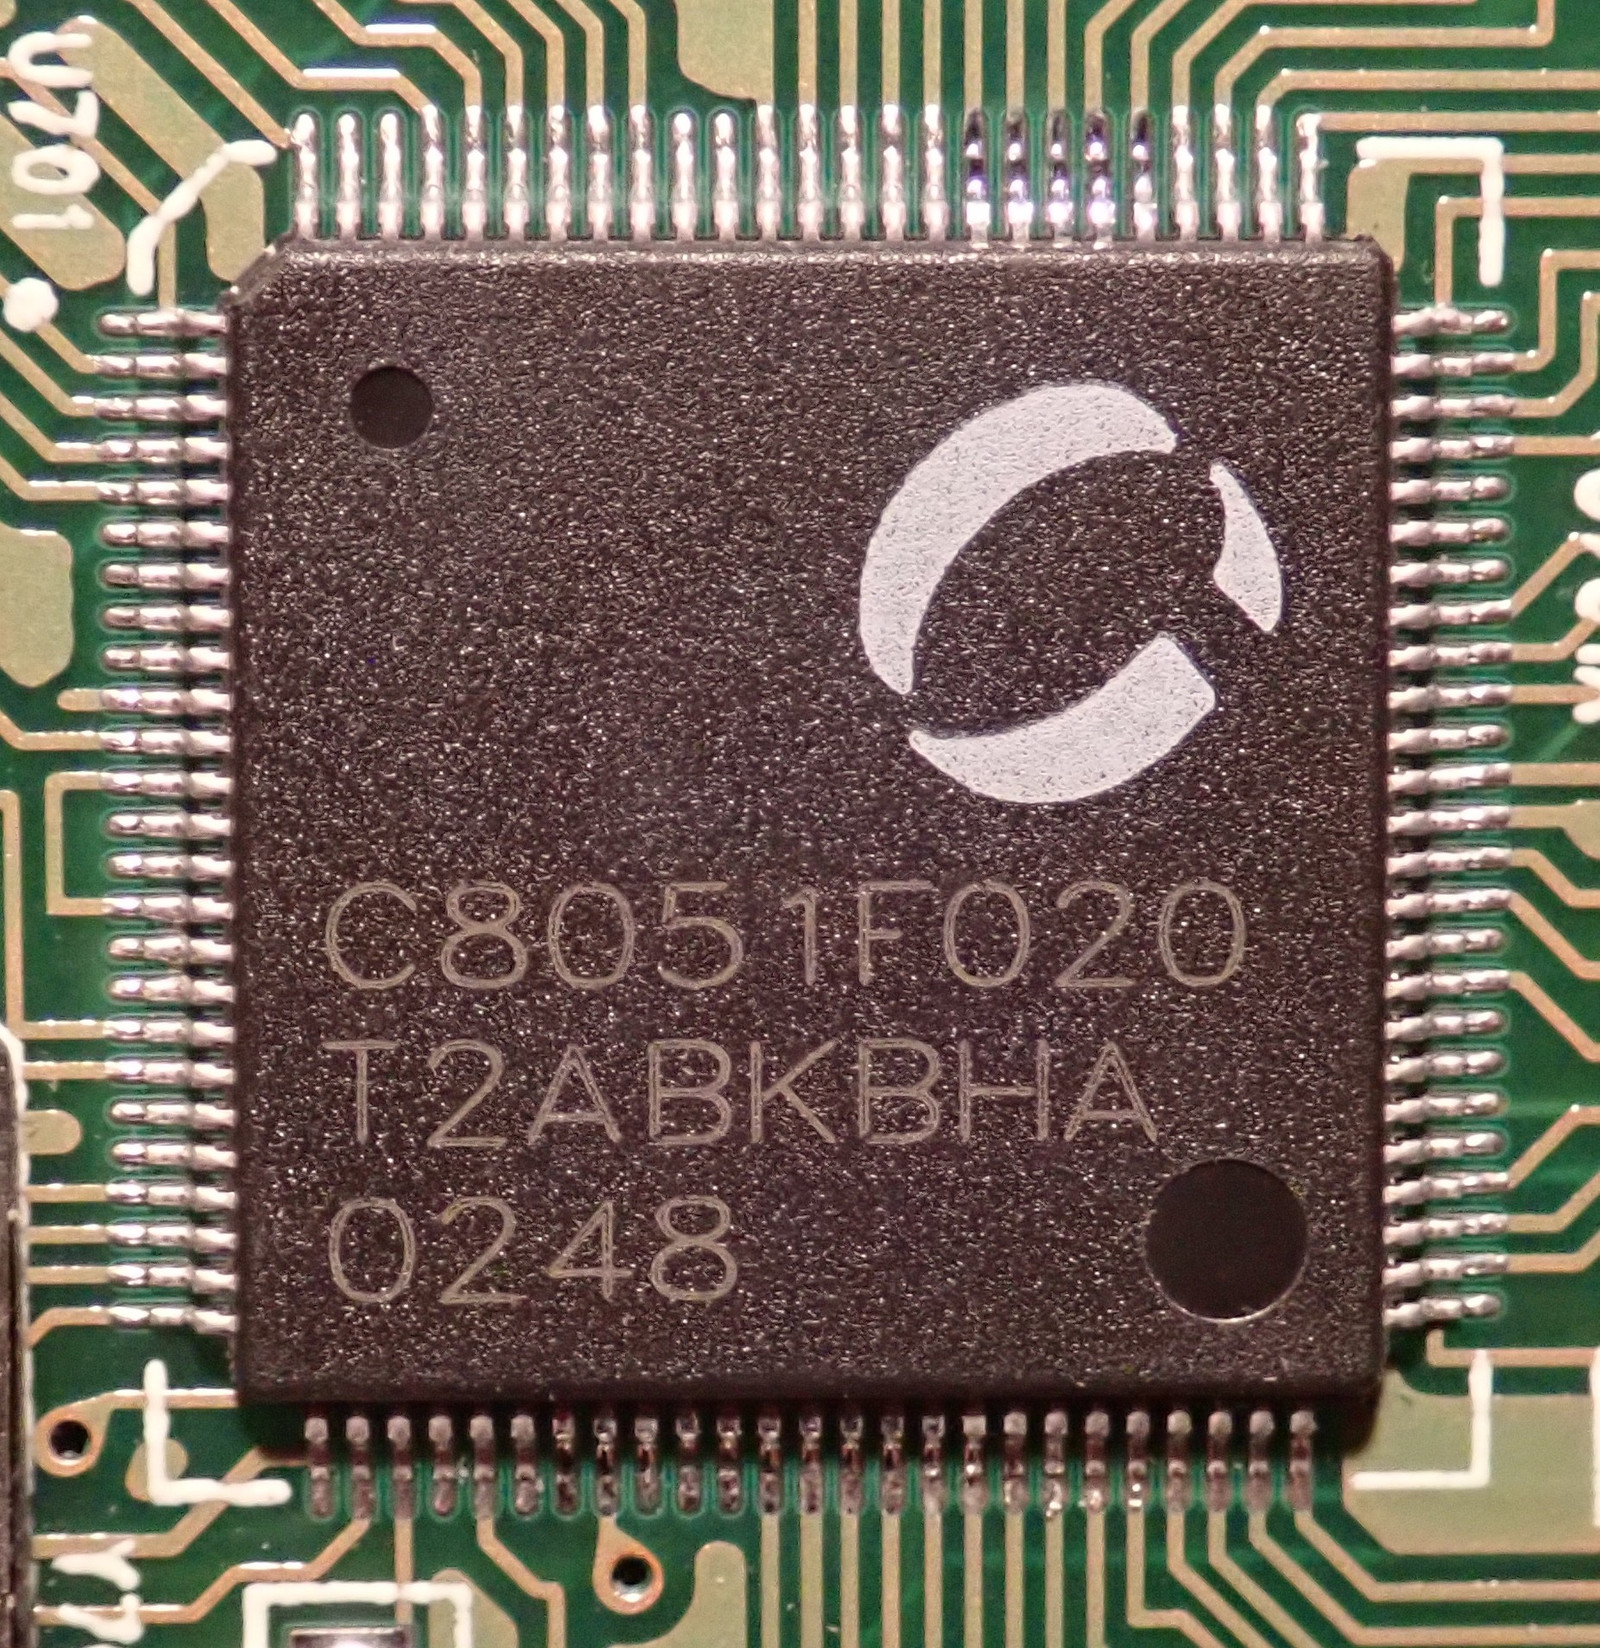
Meanwhile, the Silicon Labs C8051F020 is an 8051 based SoC - a general purpose microcontroller that likely runs the bulk of the system. The 020 variant is a 25 MIPS version, 64k flash memory, and a whopping 4352 bytes RAM. Five timers, 8x 12-bit ADCs, 12 bit DAC… not a bad little chip.
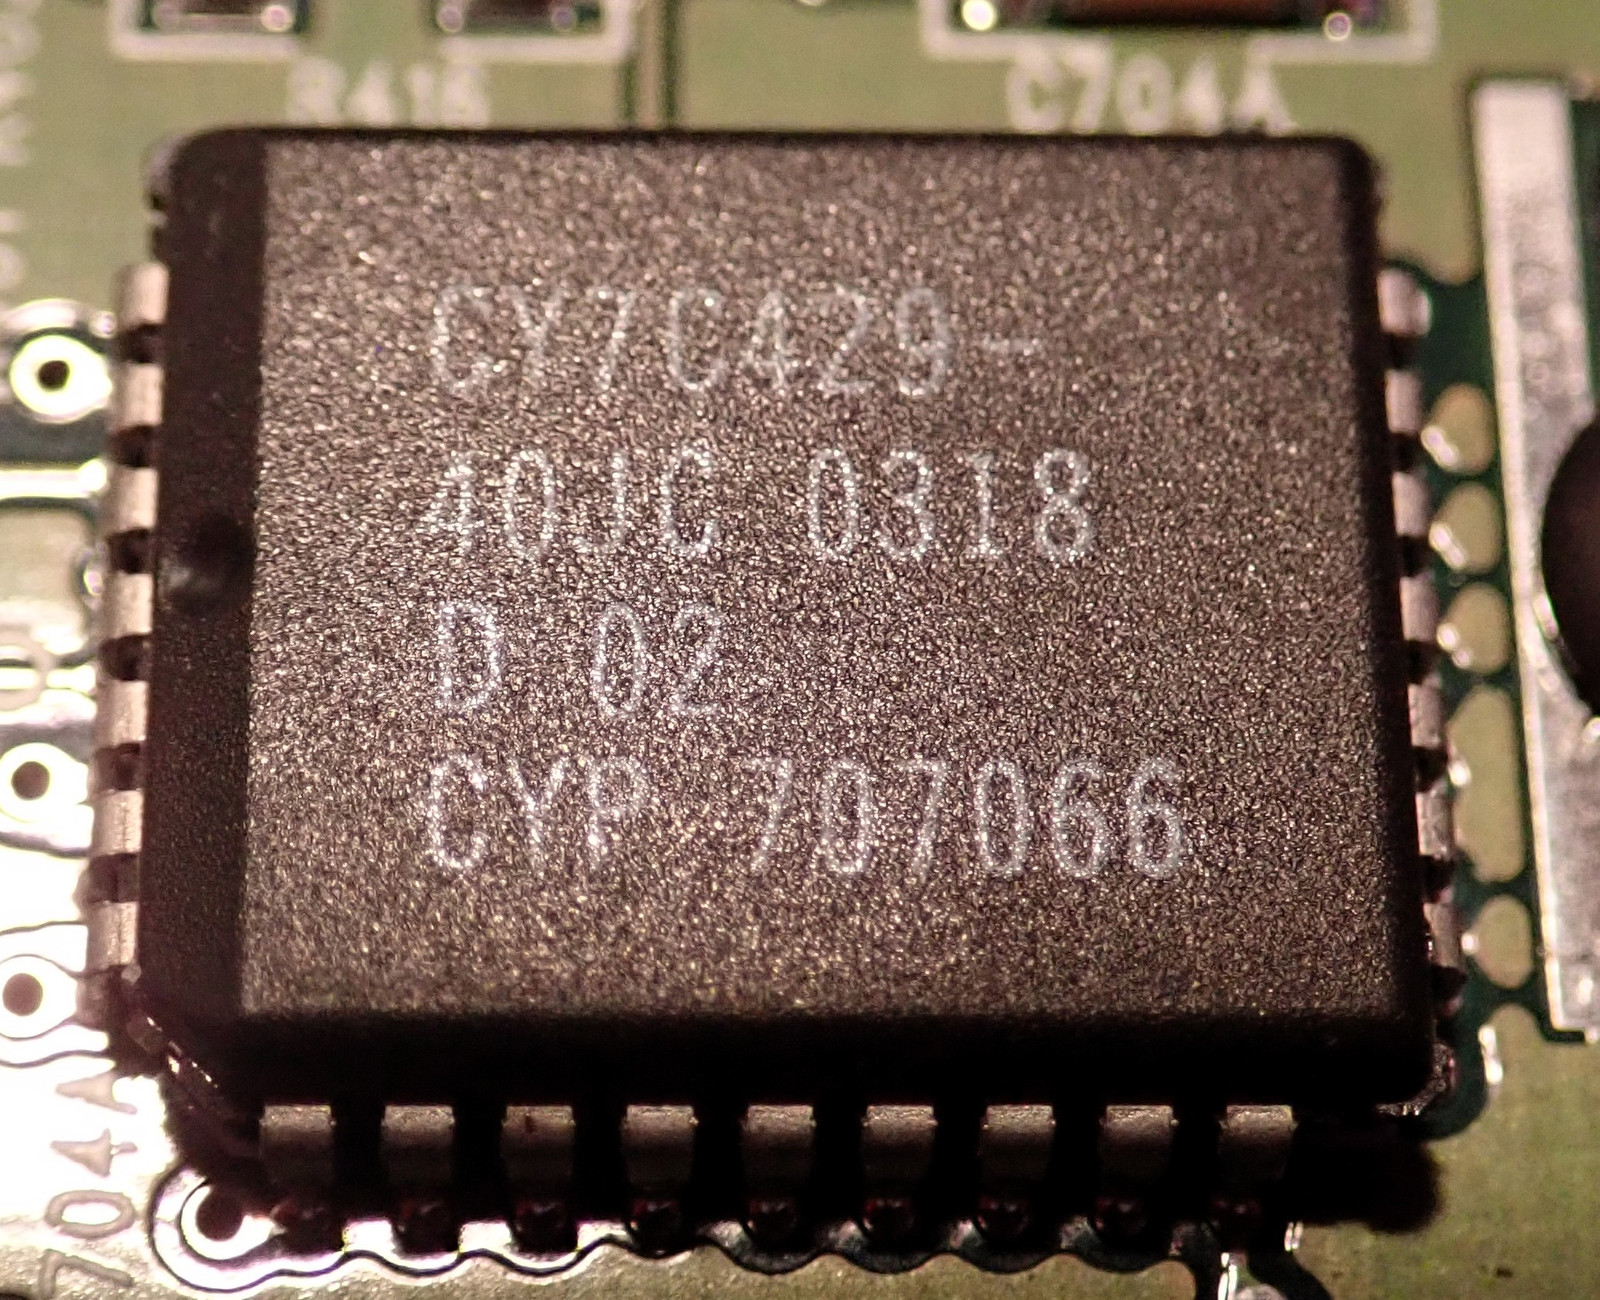
The Cypress CY7C429-40JC is an asynchronous FIFO buffer, in 2K x 9 configuration, at 20MHz.
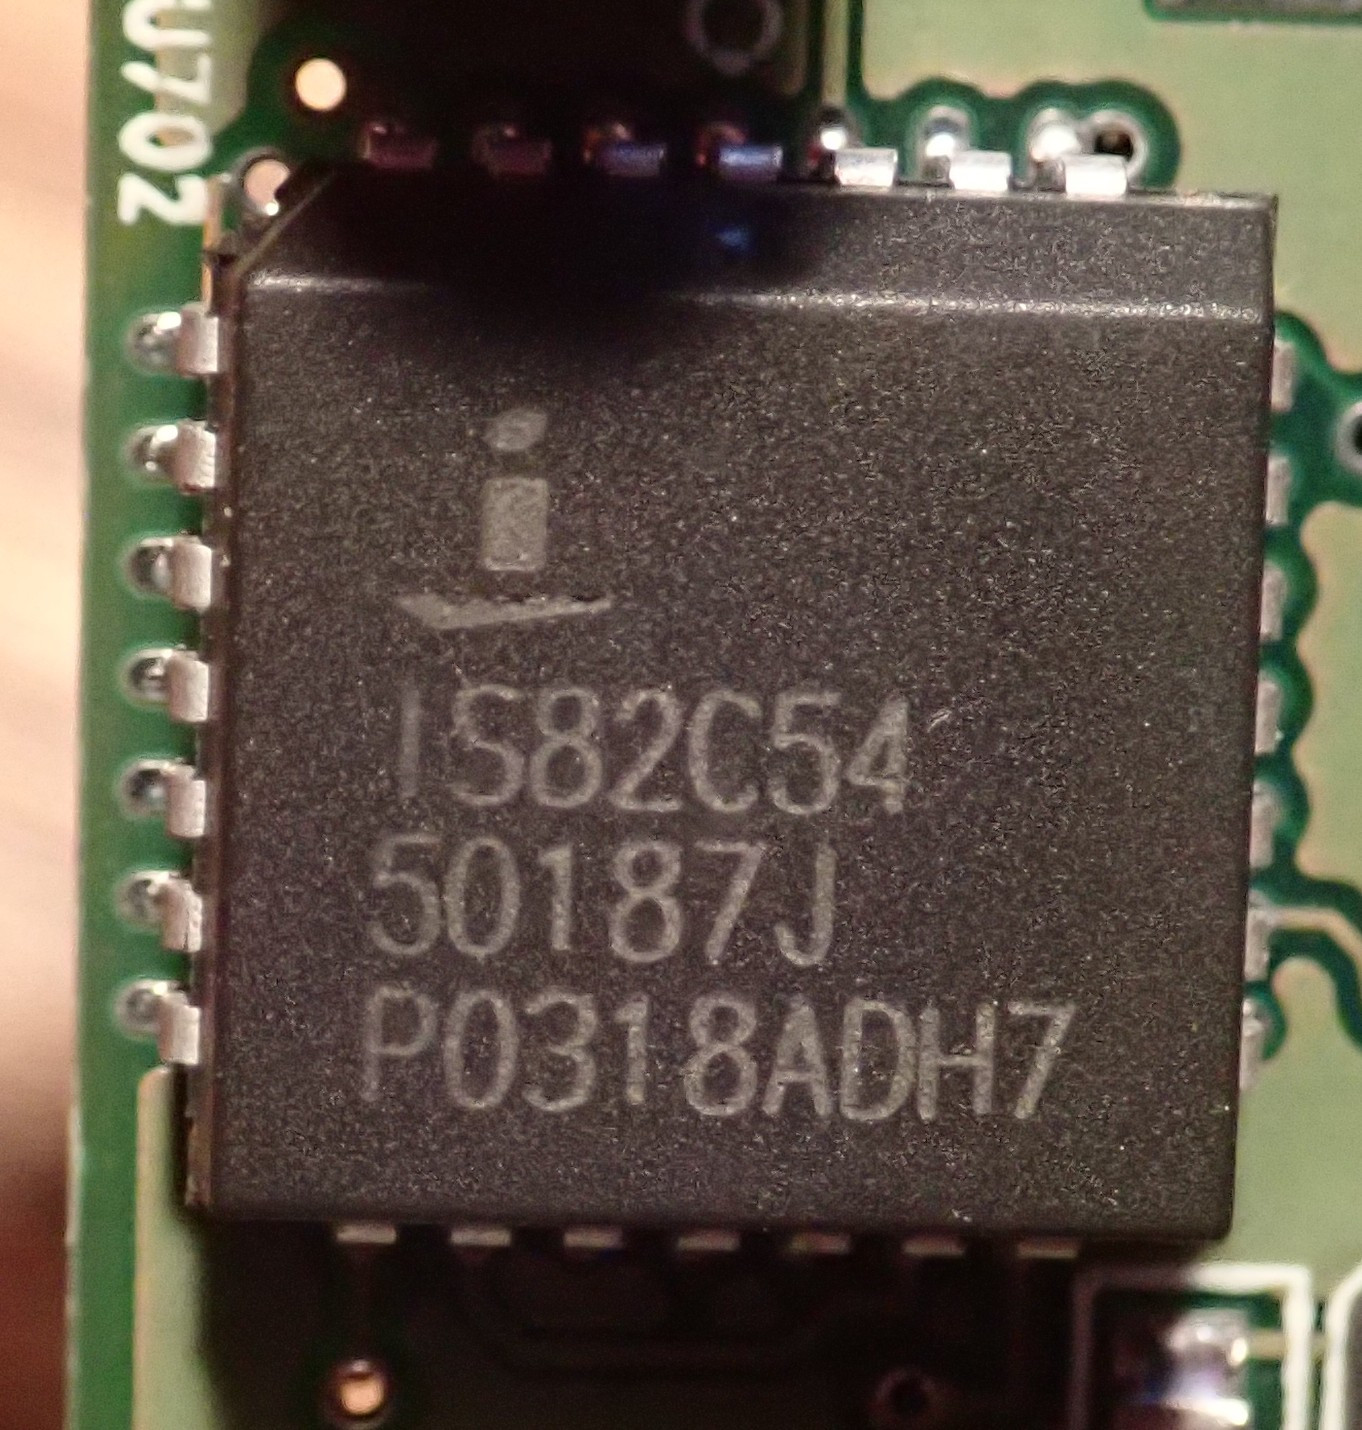
Elsewhere, an Intersil IS82C54 is a high performance CMOS Programmable Interval Timer! Three separate 16-bit counters capable of working up to 8MHz.
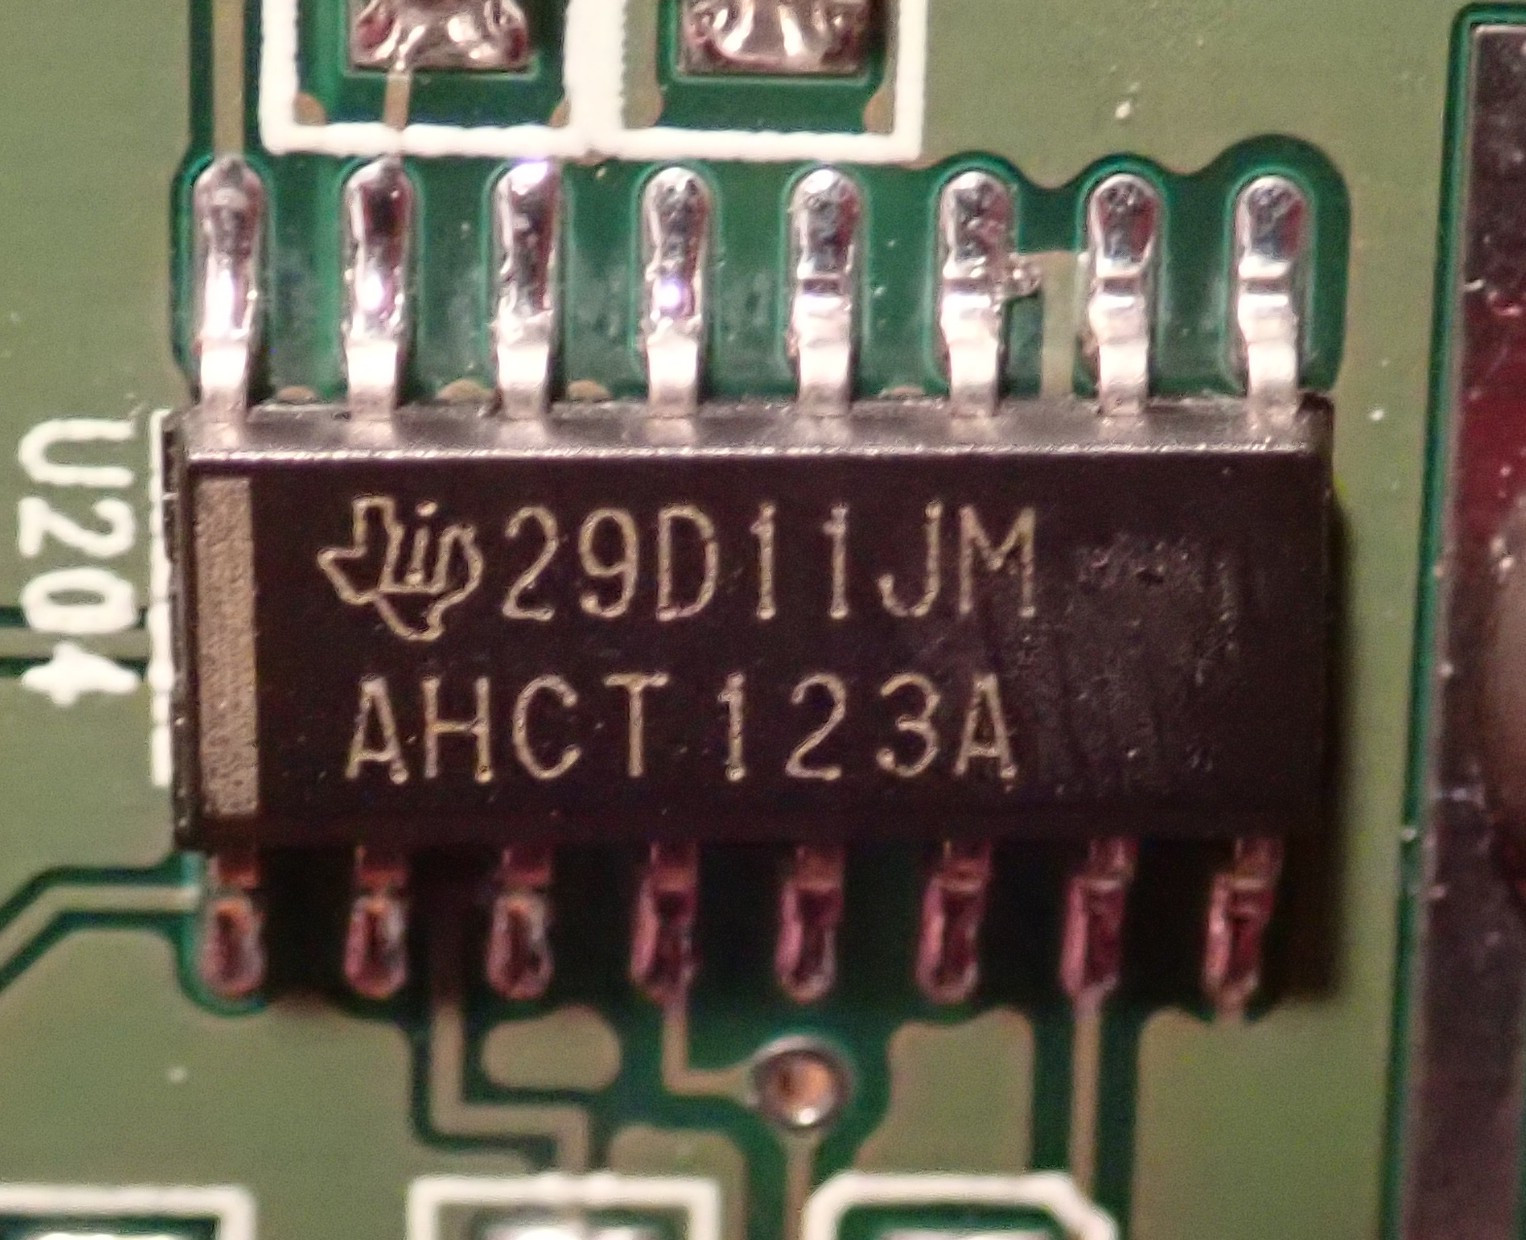
Continuing along with the Texas Instruments AHCT123A, this is a dual retriggerable monostable multivibrator! I just like the older TI logo.
It’s a quite complex little bit of electronics, and based on the prices for the electronics, it would not have been cheap. I’m sure these are fairly low volume production, too. It’s not like every streetcorner has its own spectrometer…
But, connections are simple enough. RS232 (you’ll probably use a USB to RS232 adapter these days) to the port, 5V to the barrel plug, and wait for the LED to go red. Now it’s time to talk to it!
Software and Calibration
There are two ways to use this: The Windows software, and the direct serial communications protocol. I’ll start with the Windows software, because it’s a bit easier, and does generate some nice graphs, if not “out of the box,” then close to it.
Science Surplus has a Spectrometer Resource section, and in there, you should find a handy-dandy Spectrum Studio Setup program. Download and install it. I’ve tried it on wine and it’s cranky, so… good luck, or just do the usual Windows 10 VM thing. I use KVM, because only Linux and Qubes touch the iron anymore.
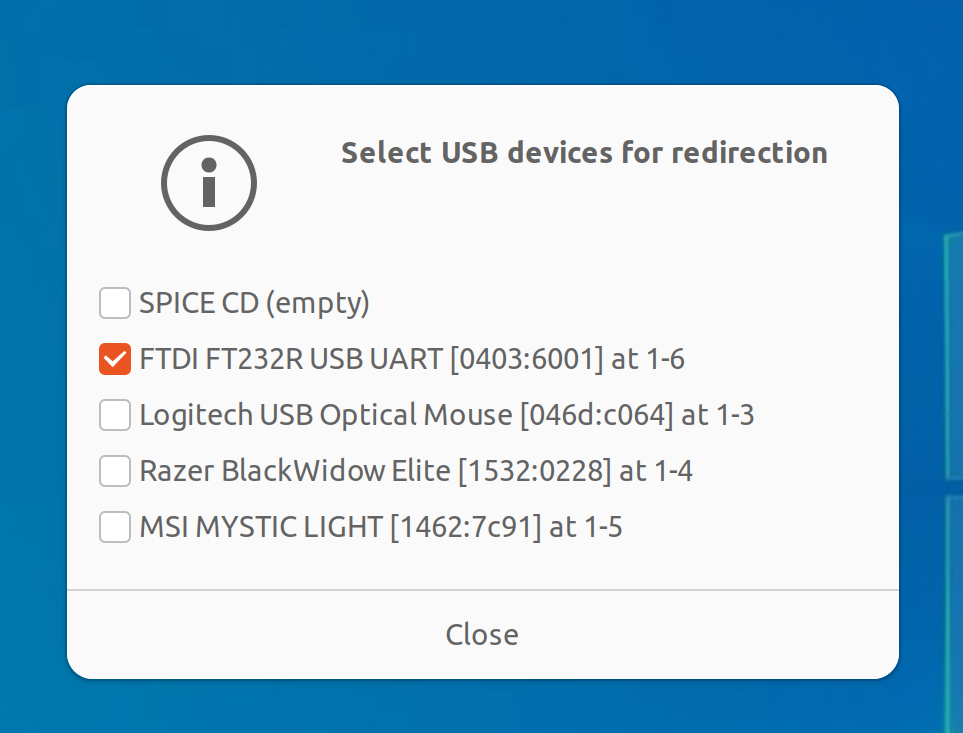
If you have a USB to RS232 cable, you’ll need to redirect it to the VM. Yes, even after the debacle, I still like my FTDI devices. I’m sure random Chinesium would work just as well if it’s got a Windows driver.
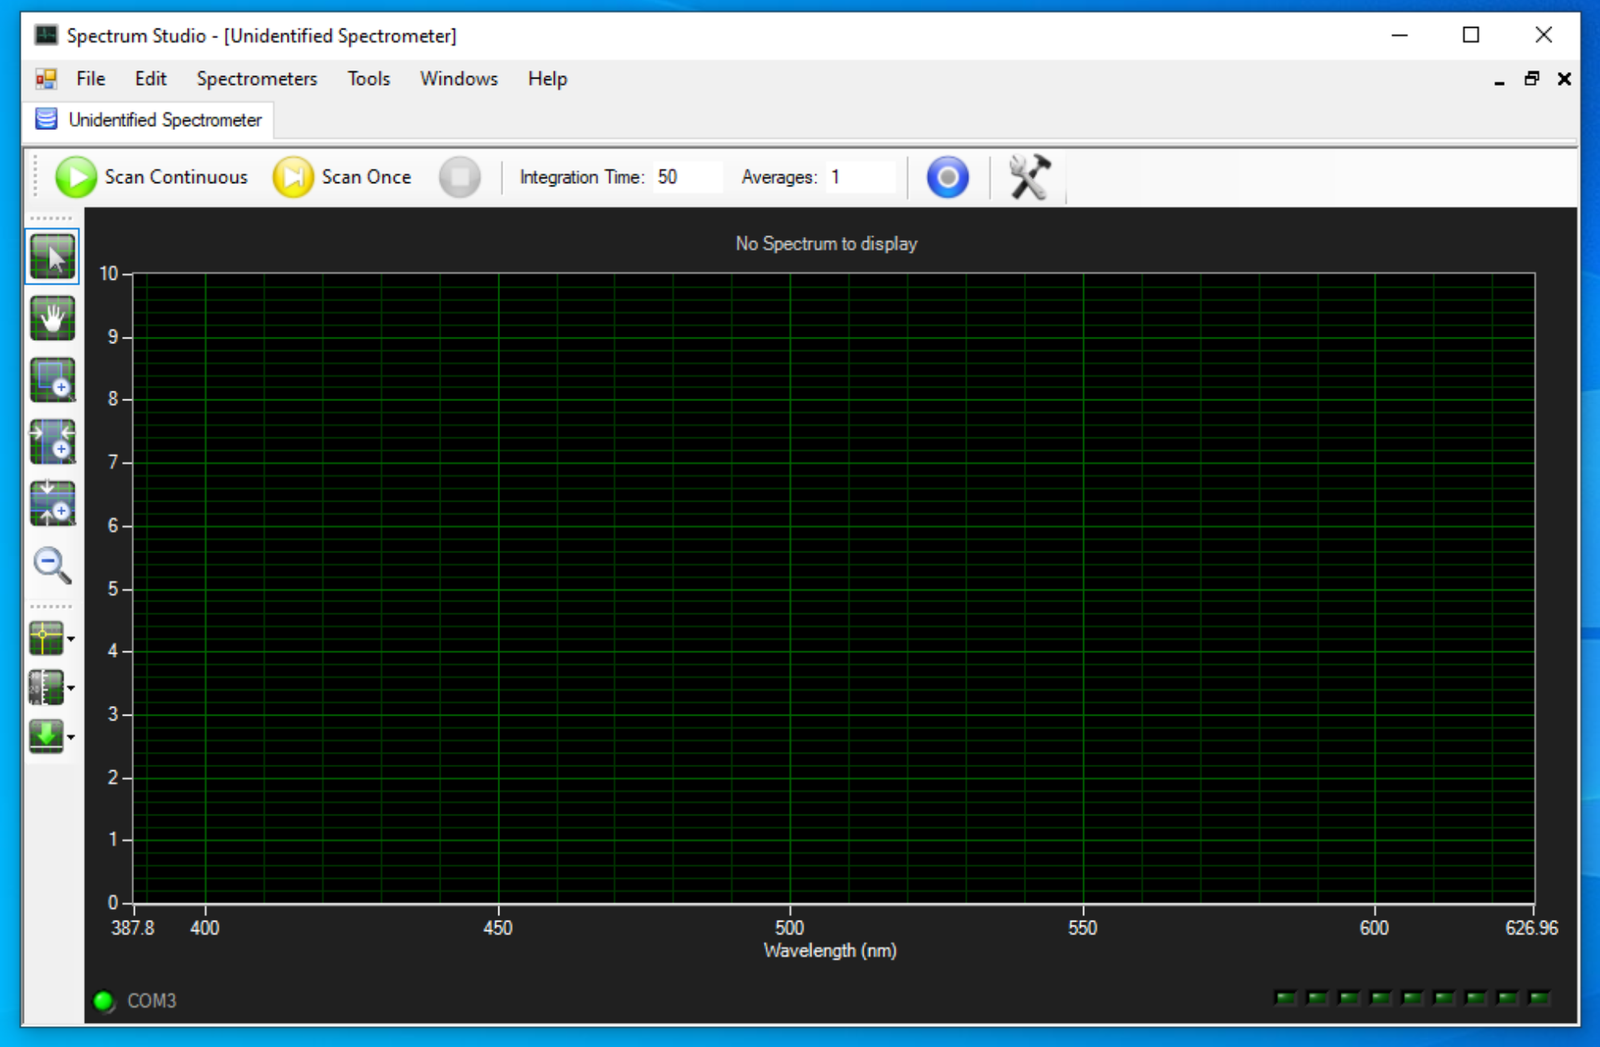
Get your VM running, redirect USB, and launch Spectrum Studio. Ideally, you’ll see this - a blank window, with no spectrum - and an “Unidentified Spectrometer.” Great! This is, absurd though it is, the expected display! The spectrometer’s calibration curve is blank, so it doesn’t know how to display anything. Click the “Settings” icon at the right of the toolbar.
A bit of math awaits you, and you’ve no idea what values to put in. Fortunately, it will help you here. Your first step is to set C1 to “1” with the rest being 0, and you’ll see the graph of the output - just, in pixels, not in nanometers. But you should see some useful output!
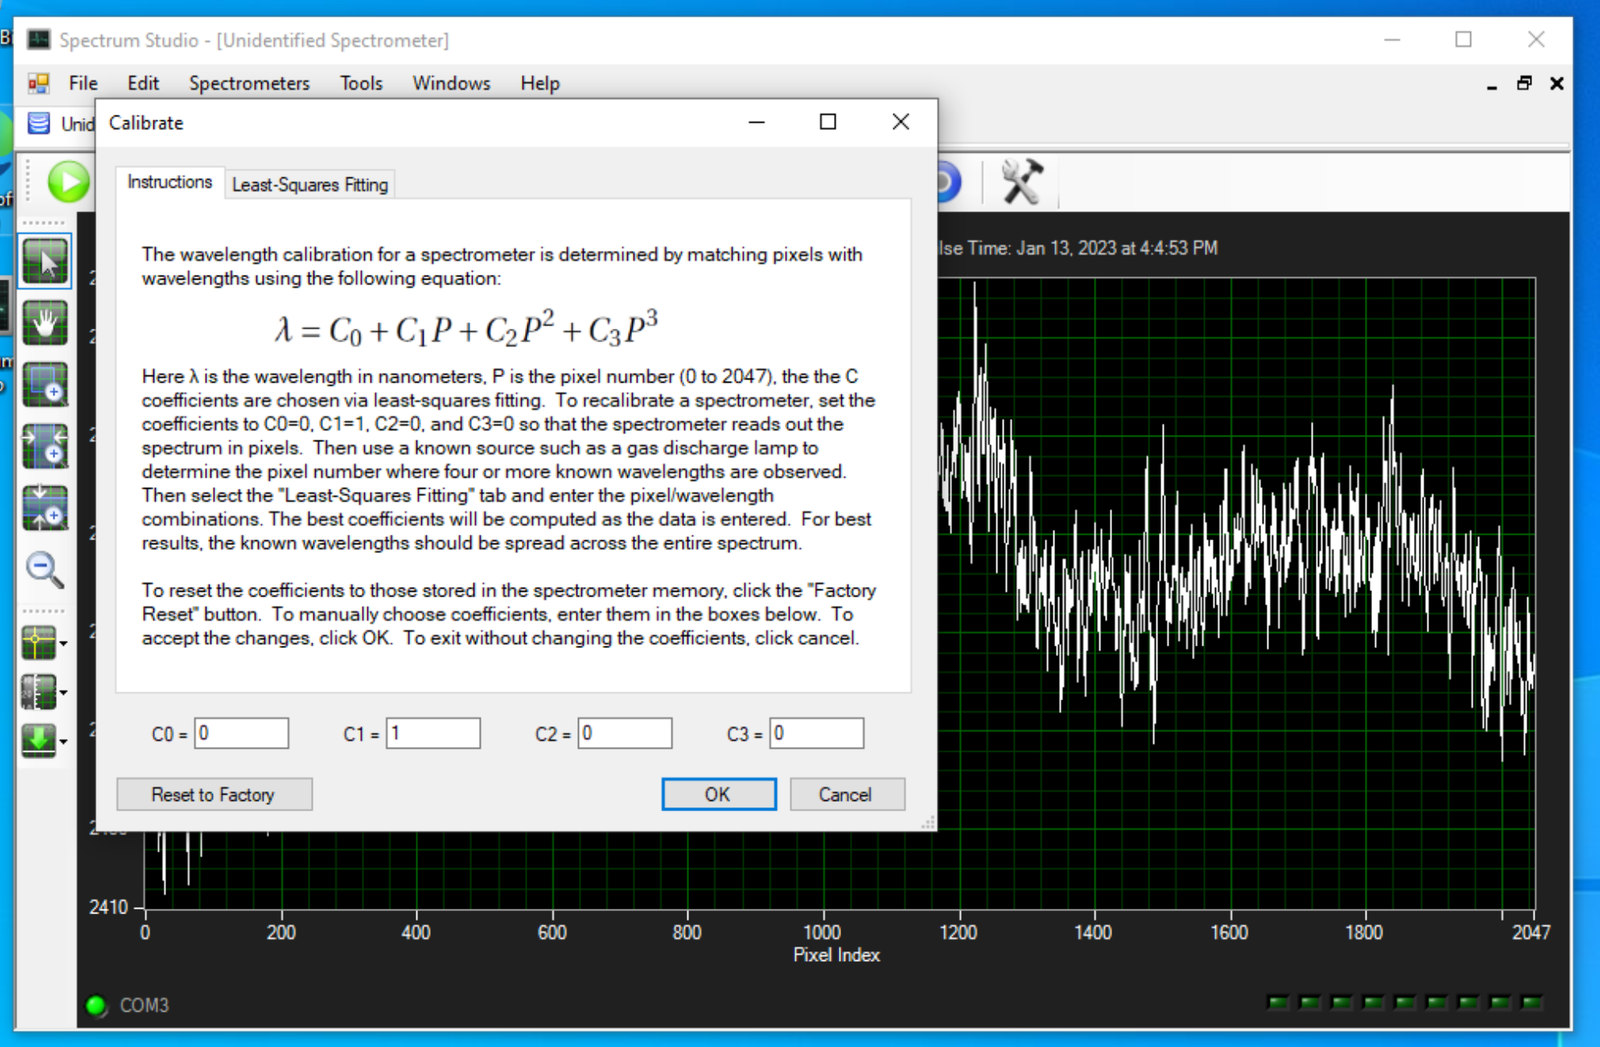
This is what my spectrometer reads with a dark input - block the sensor port with your finger in the dark, and there shouldn’t be much in the way of signal coming in. You’ll notice, on the left, that the counts per reading are still in the 2300 range. This is the noise of the sensor - and some of the pixels are a bit hotter than the rest. If you’ve ever wondered why a webcam shows static if you turn the gain up enough with a blank signal, this is why. The sensors have some thermal noise and other effects that make them emit a signal with no input. It’s just random noise, though typically hot pixels stay hot. You want to calibrate this out.
Also, now is a good time to mention that the TEC (the Peltier cooler) takes some time to cool things down. As it does, this noise floor will drop, and the counts on a black feed will drop. You might let the unit run 5-10 minutes before you bother getting a background count and setting it as the floor, if you’re trying to get really clean data.
The lower icon on the left will let you use the current spectrum as the background noise. After things have stabilized, use that option.
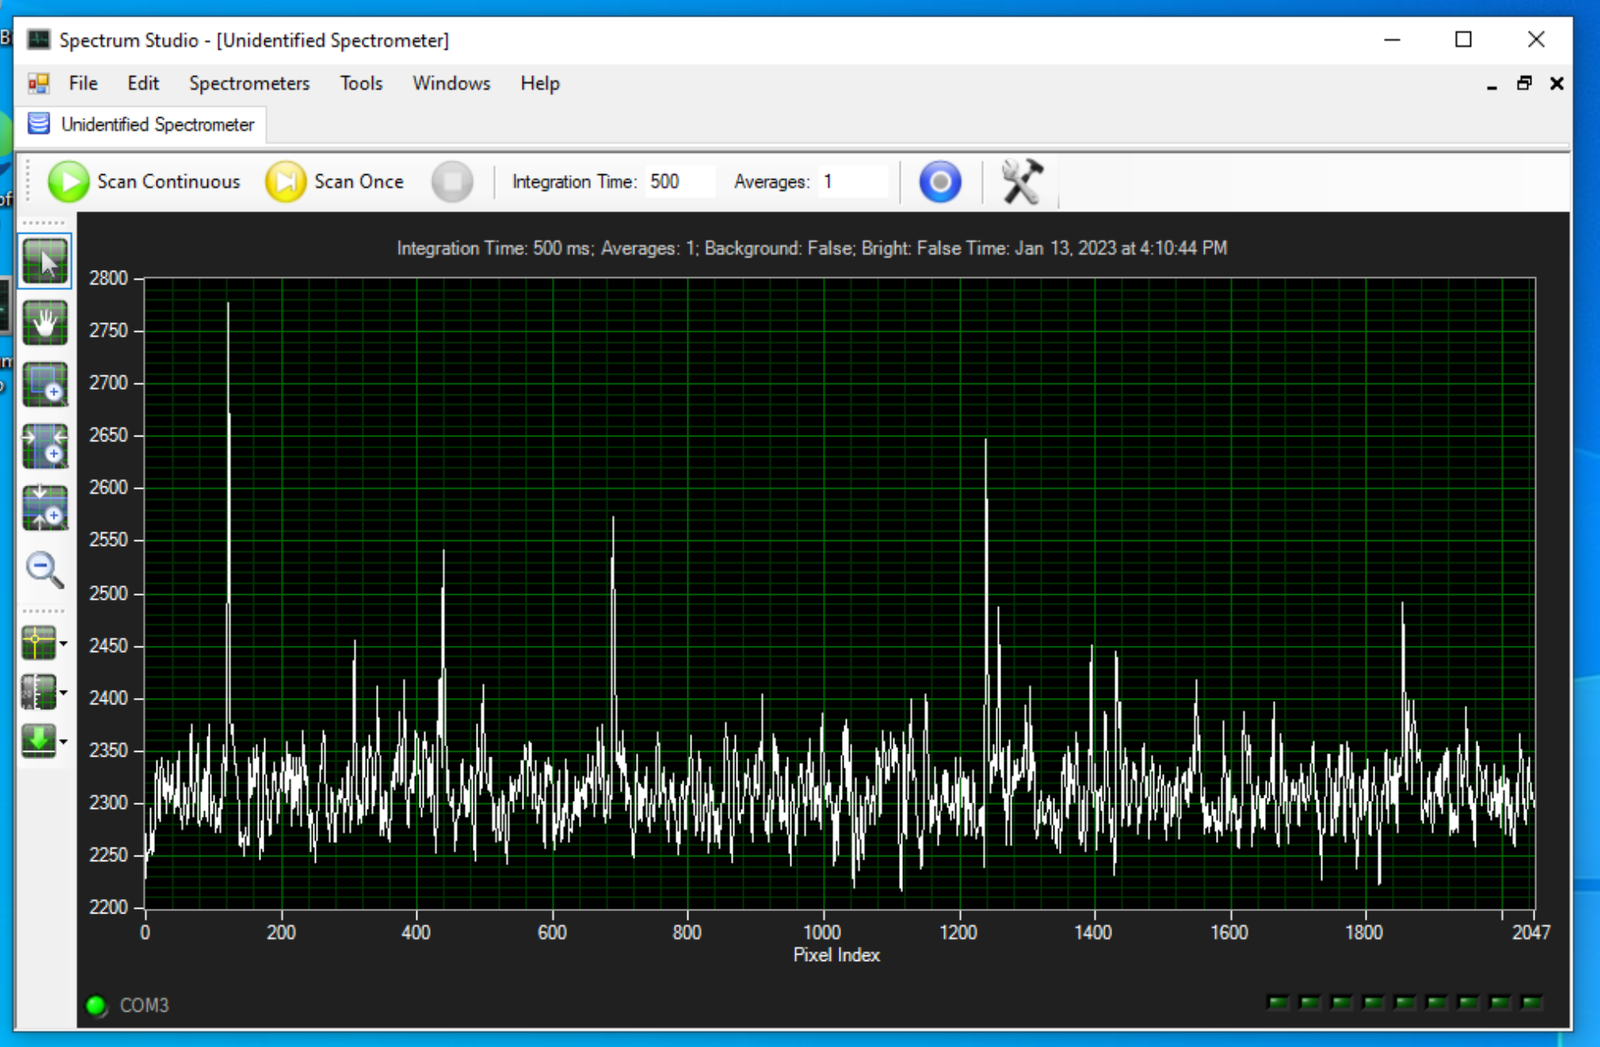
Now, you should see something like this: A narrower band of random noise, centered around zero. Good! This is what you expect, and this won’t interfere with results much.
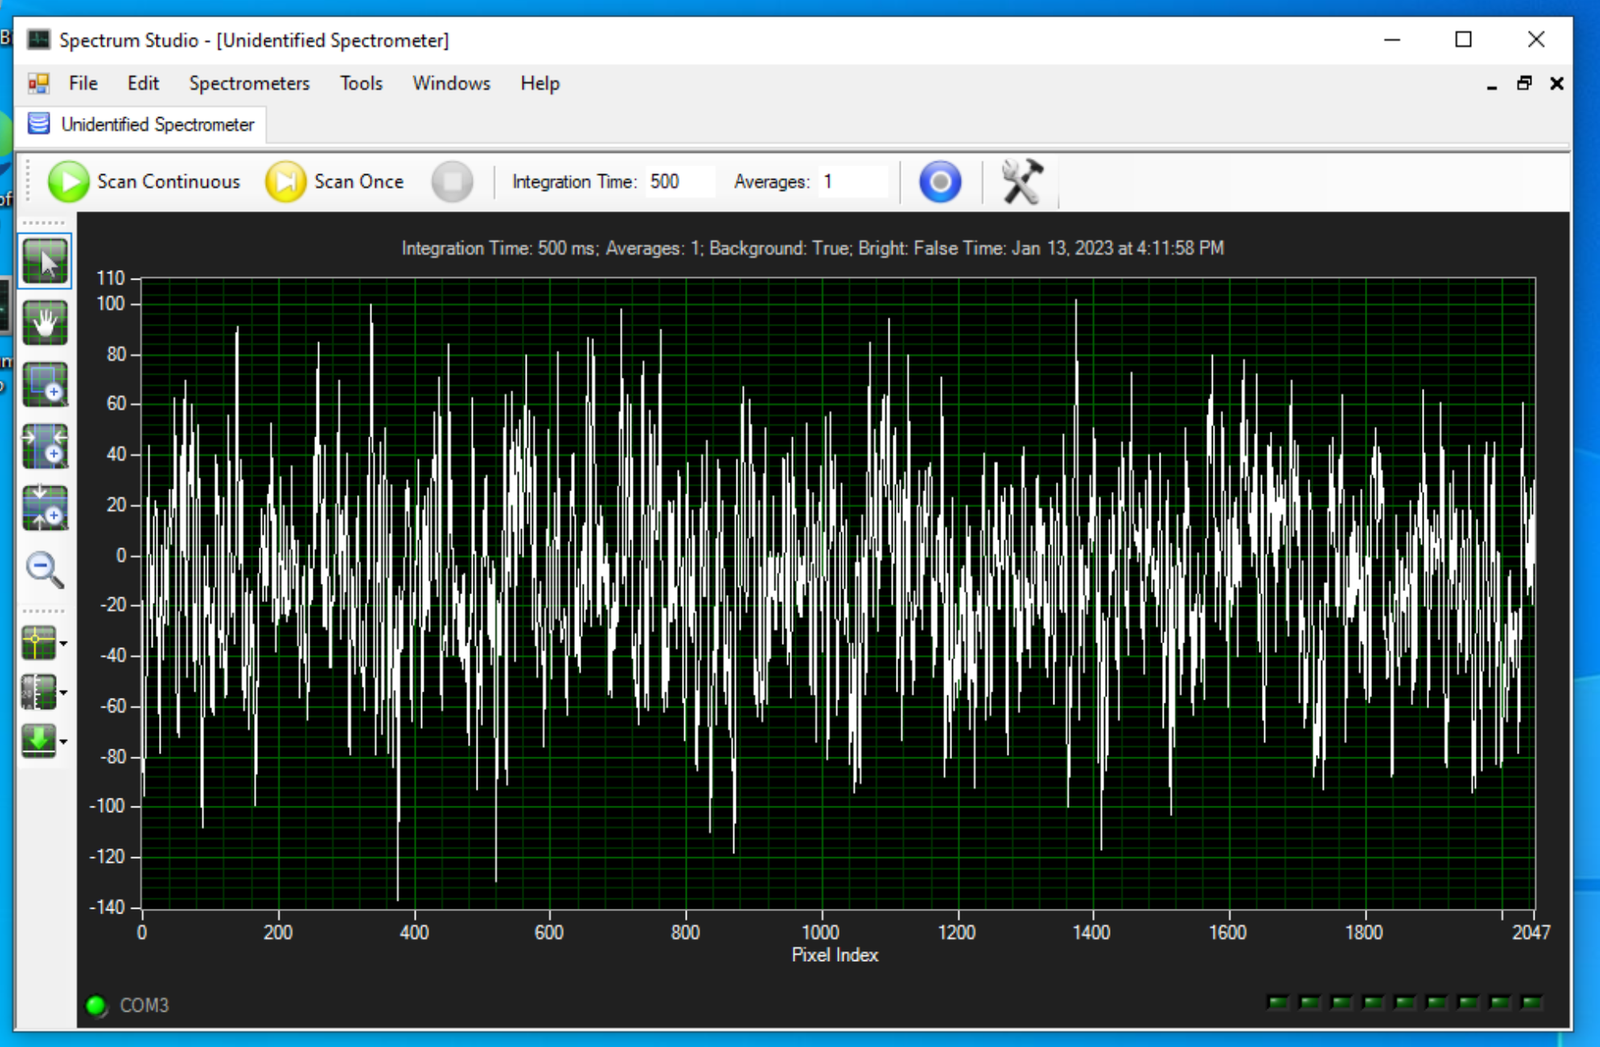
The calibration steps talk about finding a gas discharge lamp of known spectrum. I assume most people reading this don’t think they have such a thing - buuuuut, you probably do! Remember CFLs? Compact Fluorescent bulbs? Fragile mercury-filled spirals that burned out if you dared turn them on and off, stunk of burned PCB on failure, and were literally hazmat to clean up if they broke? Yeah. Go find one of those and point your spectrometer at it! You should see something more or less like this. Why did people say CFLs (or fluorescents in general) were ugly light? Well, this is why. It’s a hideous spectrum. But it’s got a bunch of easily identifiable peaks, and that is useful!
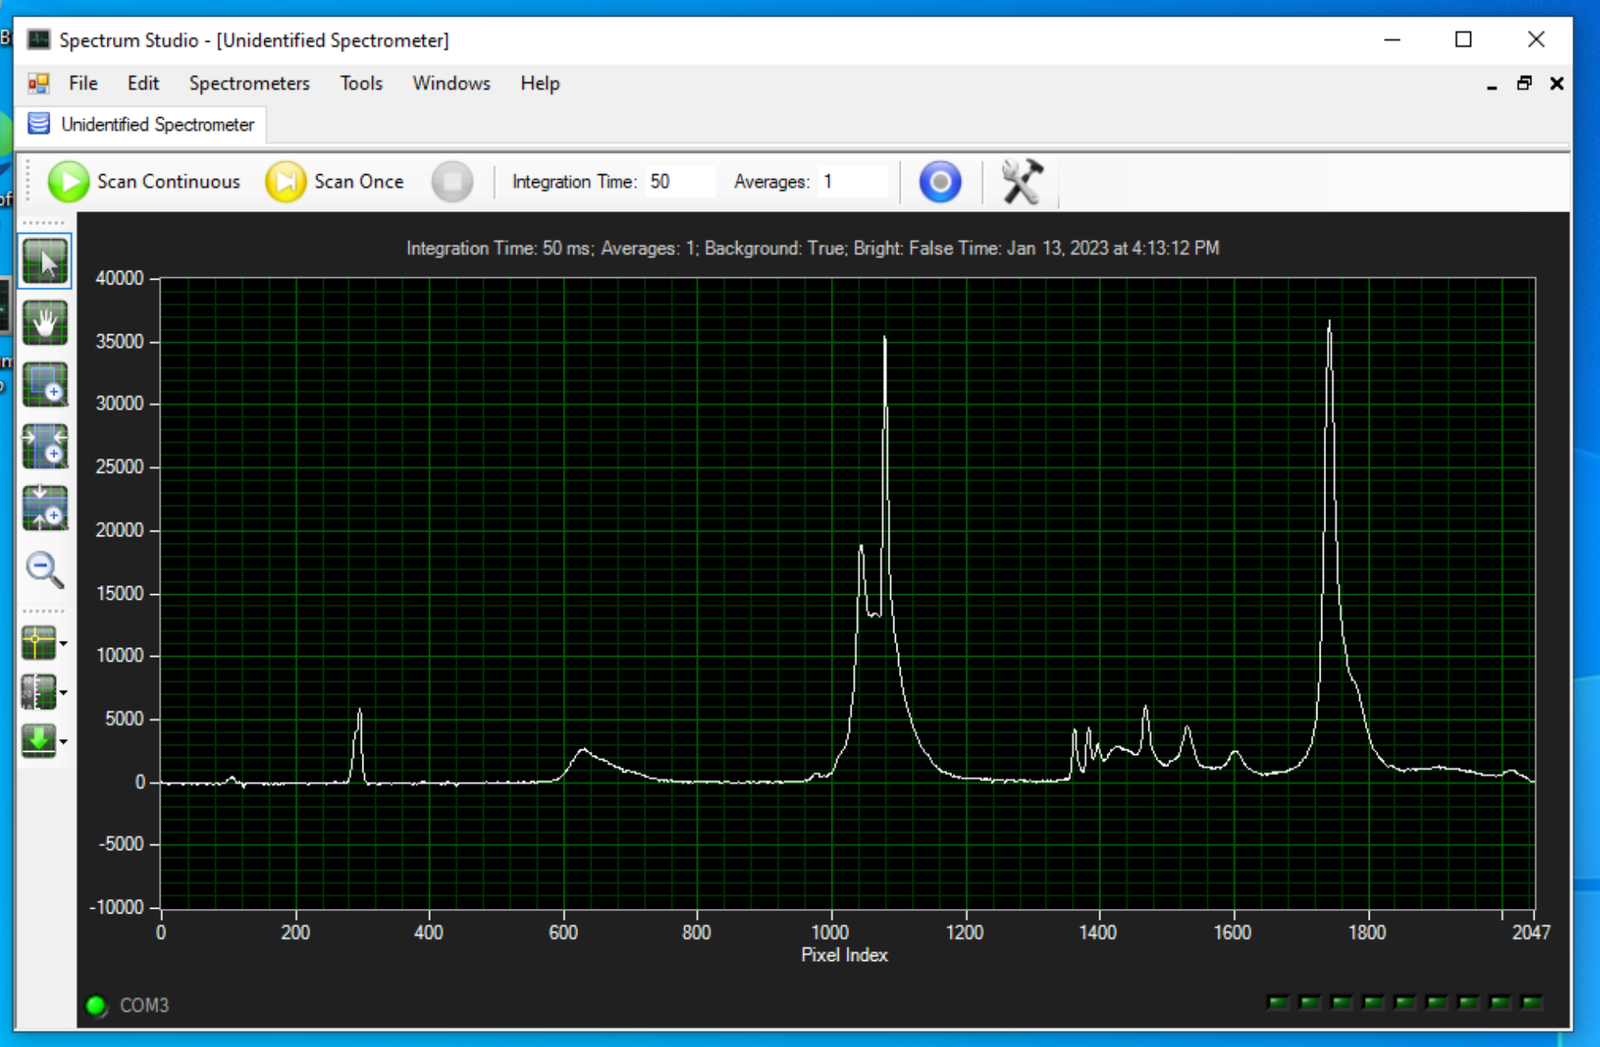
If you poke around Wikipedia, you’ll find something called Fluorescent lighting spectrum peaks labelled.png - and it should look like this, with the wavelengths of the peaks down in the text below.
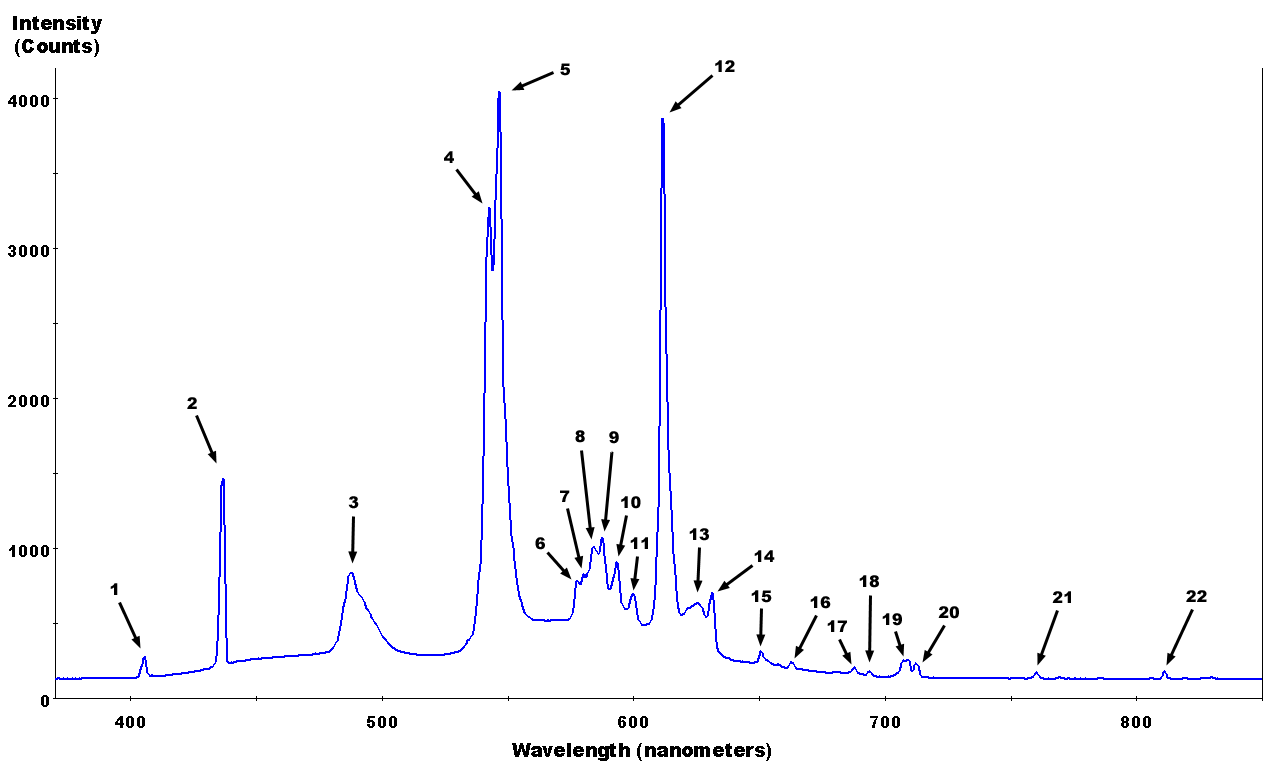
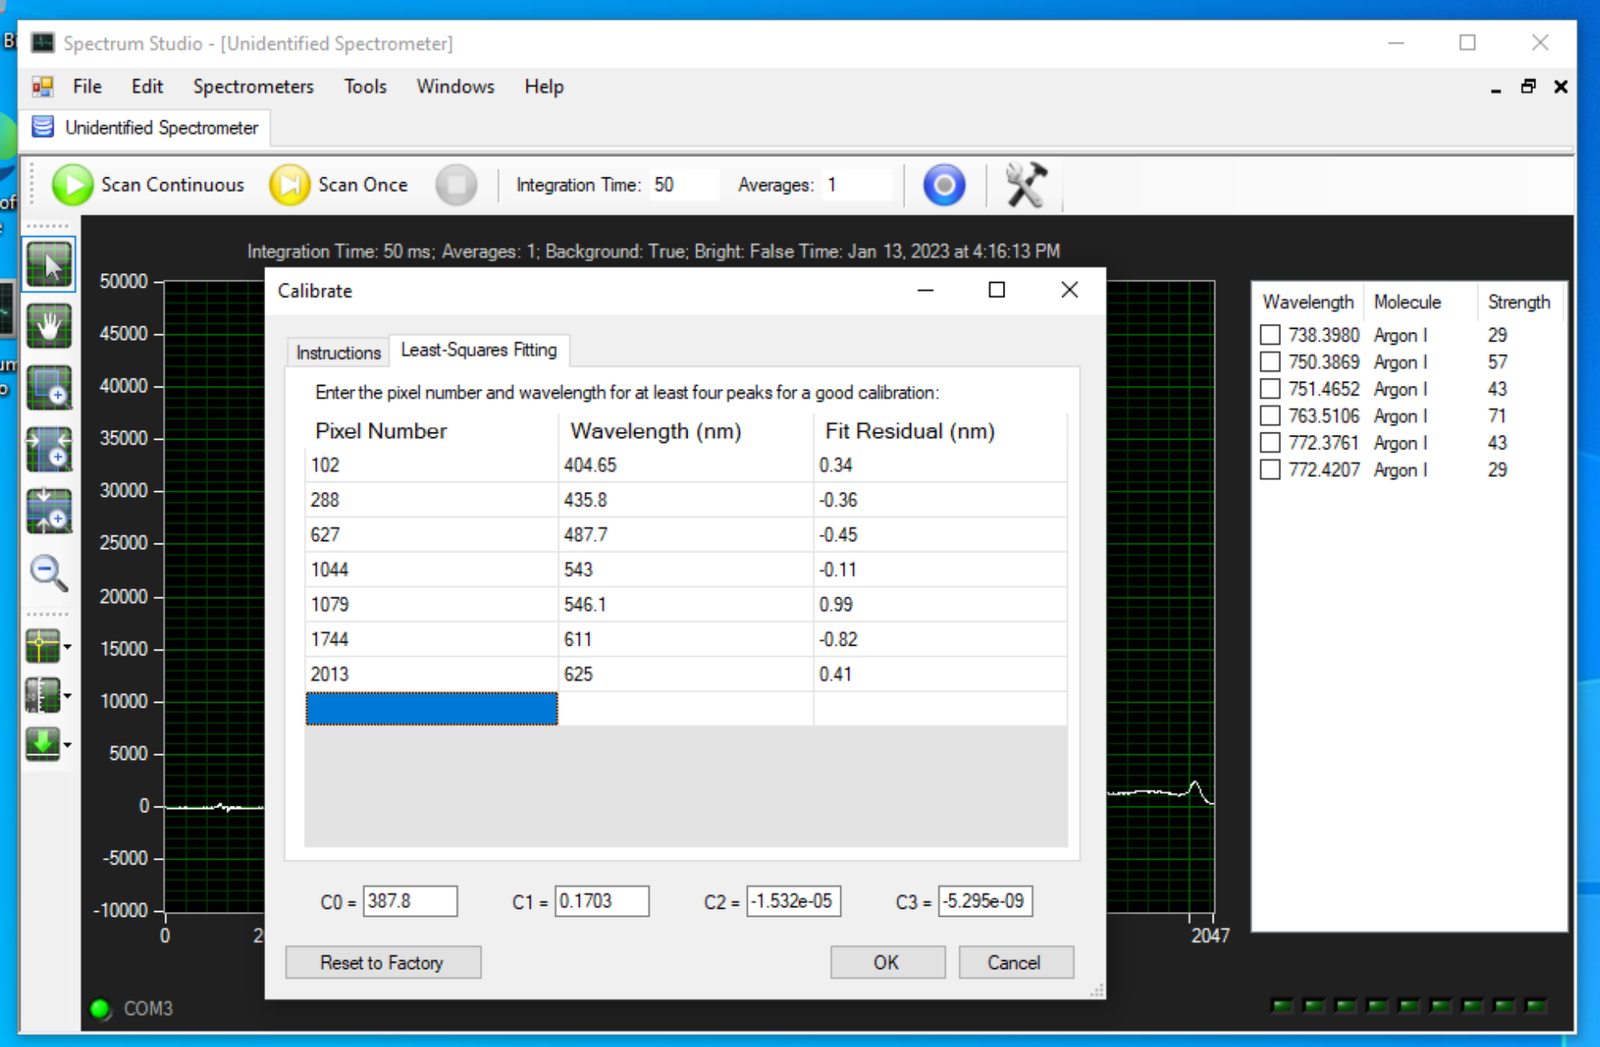
You’ll use one of the cursors to track along your spectrum and identify these peaks. You’ll want as wide a range as you can get, to help ensure you get the right fit over the whole 2048 pixels. Identify the peaks, figure out their location, and then fill them into the “Least-Squares Fitting” section of the calibration settings. Just start adding pixels and wavelengths, and once you have at least four, it’ll start doing the math. Keep adding more, and the fit will get better! At the end of the process, you’ll have some parameters calculated along them bottom, and my advice is to write them down. Preferably on something you keep with the meter. The calibration values here will be for your meter, in current configuration, so they’ll translate between installs of Spectrum Studio.
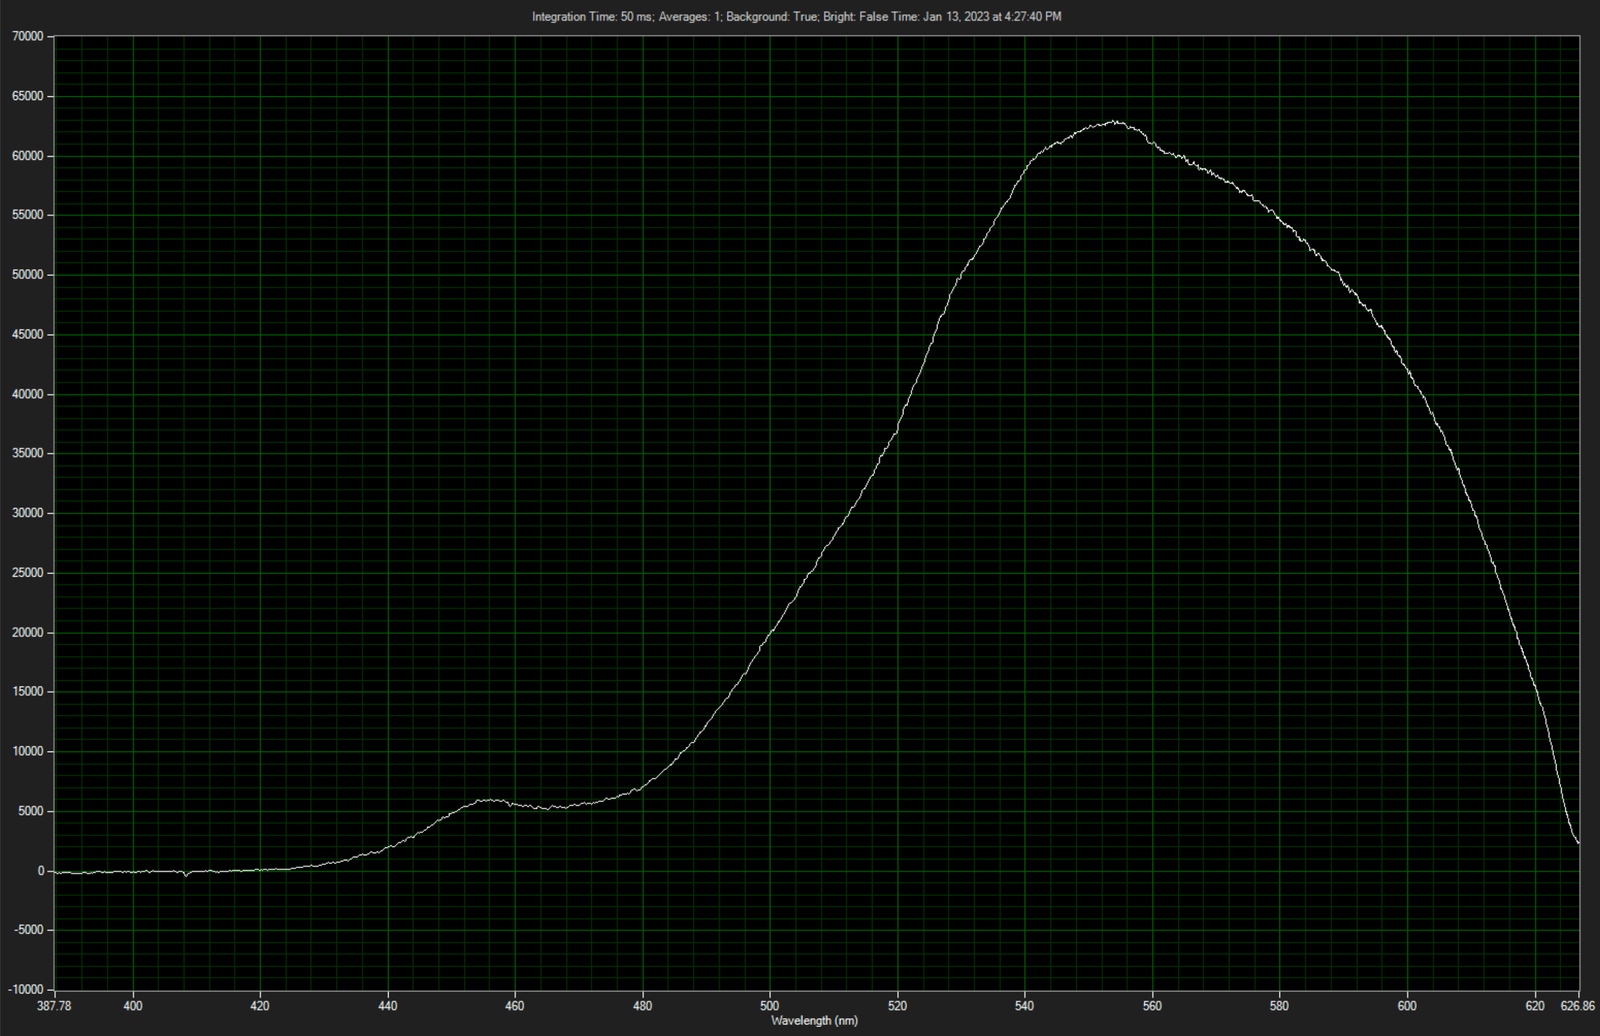
Now, point the opening at a light, and you should see something perhaps a bit like this (yes, it’s an LED). Now, you’re getting counts calibrated by wavelength in nanometers - and that’s useful. Notice, again, that the low end of the spectrum is along the zero line, not the 2000 or so line - this is because I’ve properly pulled out the background noise. File -> Save will let you save the plot off as a CSV (and if you want, you can load CSVs into the studio to compare).
Saturation and Counts
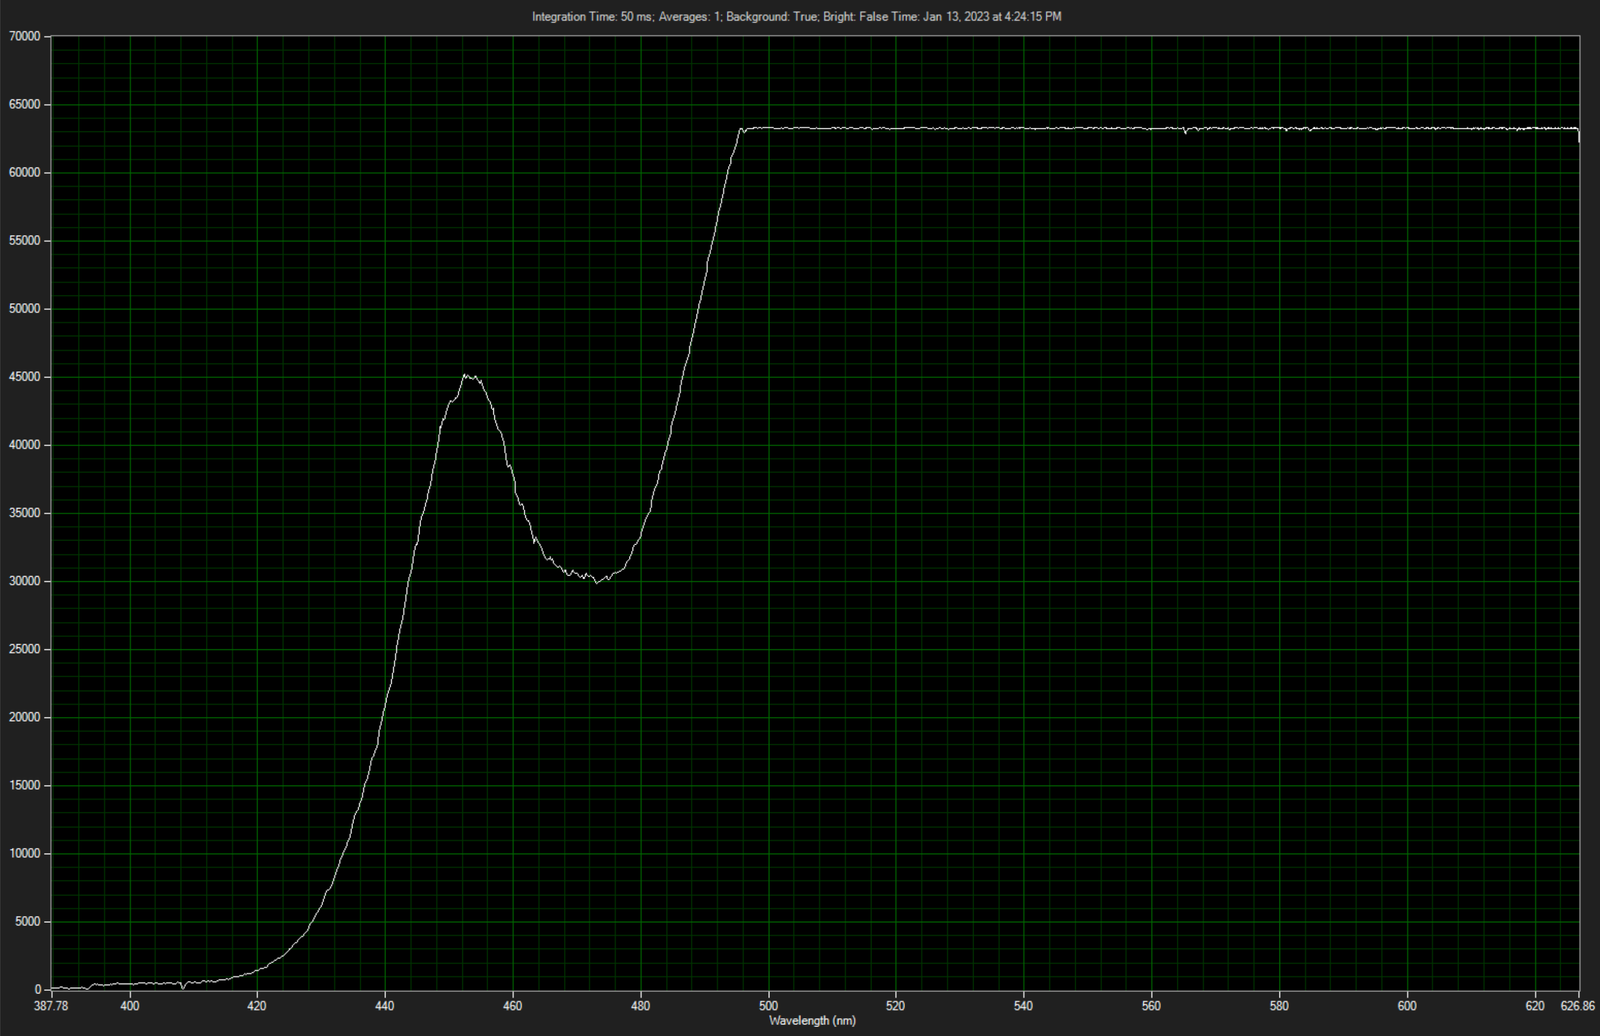
If you’re pointing the meter at a bright light, you’ll probably see something like this, with a flat line across the top. Congratulations, you’ve saturated the meter and it’s clipping. Back off from the light source and it’ll go back to proper shapes. Also, along the left, notice the counts - the maximum count this unit will return for a pixel is a uint16_t (65535), and if you’re pulling the background out, that’s minus 2000 or so - so you’ve got a maximum range of about 60,000. The closer you are to this at your peaks, the better resolution you’re going to get. Just play around, you’ll get a feel for it - if the graph is very fuzzy, try to get more light into the unit.
If you get way too much light into the unit, it’ll simply refuse to report anything. Again, back off on the light intensity.
The Serial Interface
If you want to talk to it more directly, you can - and the command set reference is included in the help file of Spectrum Studio. But, because it’s not otherwise reproduced on the internet that I’ve been able to find, a quick reference:
The default serial parameters are 9600 baud, 8n1, no flow control.
For the most part, numbers are ASCII - so for the following command, “A10” is how to request averaging 10 samples before returning. And for almost all the “set parameter” commands, “?{letter}” will return the current value - so “?A” returns the currently set value for the averaging count.
A{int}: Number of spectra to average before returning results. This will delay returning results until the average for all is done.
I{int}: Set the integration time in milliseconds. This is how long it counts for one sample. Valid range is 50-65000.
K{int}: Set the baud rate. 0: 115200 1: 38400 2: 19200 3: 9600 4: 4800 5: 2400 6: 1200 7:600
Q: Reset the spectrometer, returning all values to default.
S: Initiate a scan and return the values, either in ASCII or binary mode.
a: Set ASCII mode. Results are returned in human-readable counts on the terminal.
b: Set binary mode. The results are compressed, as described below.
In binary mode, each pixel is compared to the previous value. If the value is +/- 127, a single signed 8-bit int encodes the difference. If the difference is greater, a three-byte sequence is sent: 0x80 (flag value that the next byte is the full value), {high order bits of the 16-bit uint}, {low order bits of the 16-bit uint}. It seems straightforward enough to decode, I’ve just not written software to do it because Spectrum Studio in a VM is fine with me.
Optical Fiber
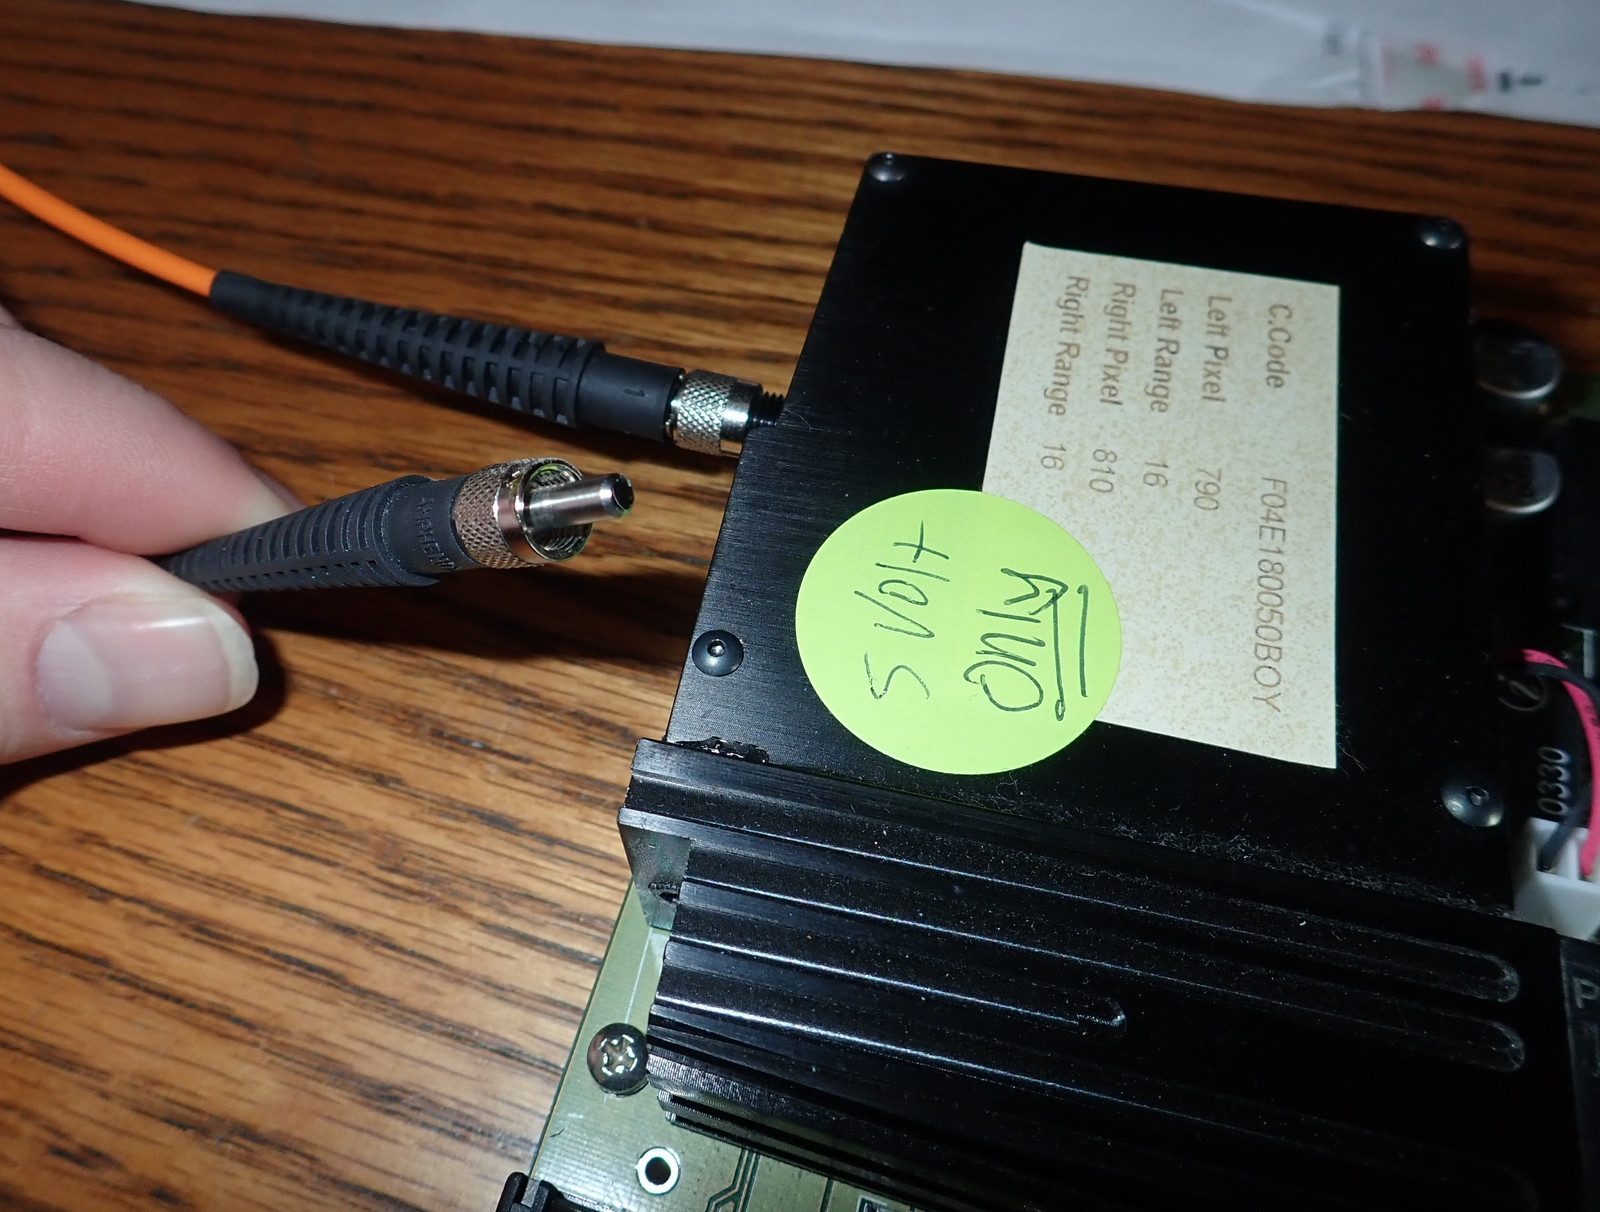
If you want to allow for better remote sensing, you can add a length of SMA 905 terminated optical fiber. Screw it into the sensor, and point the other end at your desired light source! The main problem here is that optical fiber is expensive. It’s useful, it eliminates some of the possible weird reflection problems (I’ve seen some input angles leading to weird sensor results that look like scattered light), but if you just want some data, you can probably skip it. Up to you. The stuff isn’t cheap.
Range and Sensitivity
If you open the bench, you can tweak the alignment of the optics (if you wanted to read deeper into the red, for instance). However, talking to tech support (I found someone who was surprised to hear questions about such an old unit, but was also able to find information), this unit’s designed range is 400-580nm. It has an 1800 groove grating, with a blaze at 500nm. So, if you notice the red tapering off faster than one might expect, that’s correct - red is simply out of the designed operationg range of the unit. But, I’m more interested in the blues, and this unit is well suited to work in the 450-500nm region, with enough on both sides to be able to see what’s going on. I’ve found a calibration chart for the unit, and I may try to put some calibration utilities together at some point, but it’s working for what I want, so I’ve not messed around with the insides.
Creating Charts and Graphs
If all you need are the line graphs labeled in nm, Spectrum Studio will do just fine for you. But if you want something better, and perhaps something with a little bit of background art to show where the colors lie in the spectrum, it’s time for some gnuplot! No, I’m not good at it, and I’ll entirely admit to this being a bit of cargo culted copypaste. But it does work!
The following, named spectrum.gnuplot, handles the actual charting.
lmax = 630; lmin = 380
k=lmax-lmin
set cbrange [lmin:lmax]
r(x)=x<440?-(x-440)/(440-380):x<510?0:x<580?(x-510)/(580-510):x<=780?1:0
g(x)=x<440?0:x<490?(x-440)/(490-440):x<580?1:x<645?-(x-645)/(645-580):0
b(x)=x<490?1:x<510?-(x-510)/(510-490):0
f(x)=x<420?0.3+0.7*(x-380)/(420-380):x<700?1:0.3+0.7*(780-x)/(780-700)
set palette functions f(k*gray+lmin)*r(k*gray+lmin),g(k*gray+lmin),f(k*gray+lmin)*b(k*gray+lmin)

set term pngcairo size 1920,1200
set output "output.png"
set xlabel "Wavelength - nm"
set ylabel "Counts"

set title ARG1." - Syonyk's Project Blog" font "Courier,24"
set pm3d map interpolate 0,1
set autoscale xfix
splot '<awk ''NR == FNR {min = !min || $2 < min ? $2 : min; print; next} FNR == 1 {print ""} {$2 = min}1'' plotdata.dat plotdata.dat' using 1:2:(0):1 notitle
And, if you want to call it usefully and have it rename files, the following, say, plotit.sh, will do just that:
#!/bin/bash

filebase=$(basename -- "$1")
filebase="${filebase%.*}"
cut $1 -d',' -f2,3 | sed 's/,/ /' | tail -n +6 > plotdata.dat
gnuplot -p -c spectrum.gnuplot "$2"
mv output.png $filebase.png
rm plotdata.dat
Call it with something like ./plotit.sh input_file_name.csv "Title of chart" and you should end up with input_file_name.png showing the data!
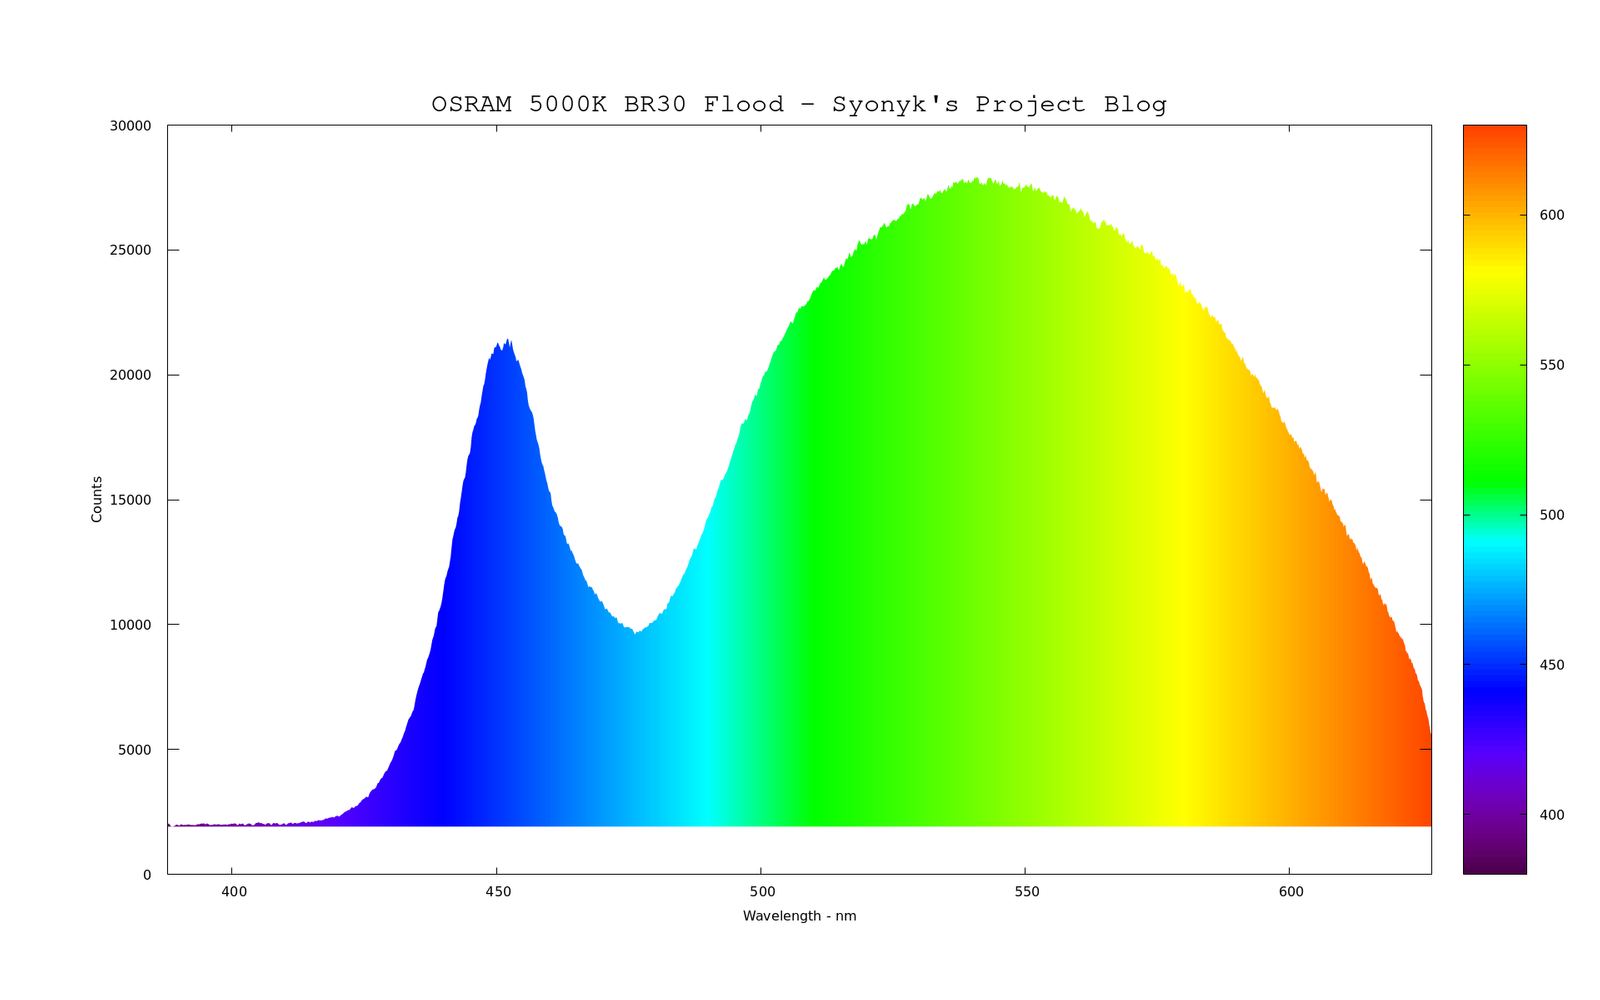
Run on some slightly different data, you get something else:
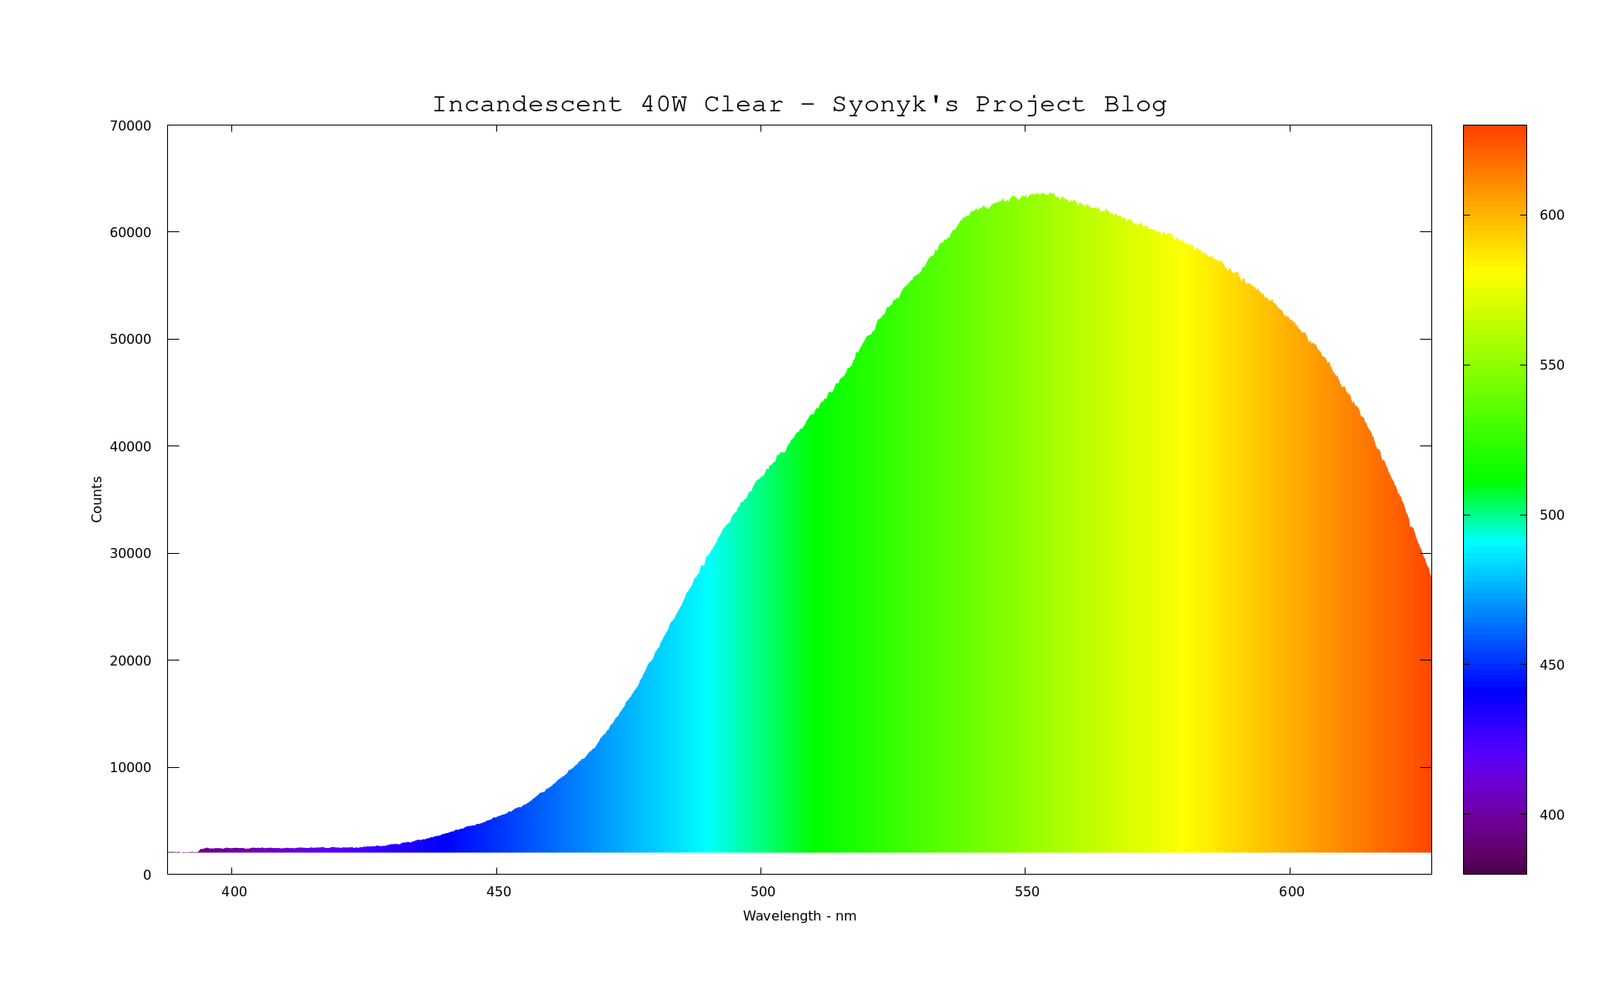
It’s not perfect, but it’s darn sure useful enough for what I want to do with it! What do I want to do with it? Well, that’s another post!
from Hacker News https://ift.tt/zsoa7kx
No comments:
Post a Comment
Note: Only a member of this blog may post a comment.