The last major update to our consumer SSD benchmark suite was introduced in 2017. A lot has changed in the SSD market over the past several years, and our SSD testing methods need to change in response to those trends. SSDs in general have been getting more complex, so there are more ways for benchmarks to end up being misleading or unrealistic. This might be on accident, or as part of a deliberate PR strategy to obfuscate the real world performance behind a holy unified metric.
The nature of testing hardware has also changed, especially in light of the need to support the latest technologies like PCIe 4.0, We also find it relevant to more closely resemble the kinds of hardware our readers are now likely to be using. This article introduces the new 2021 edition of our consumer SSD test suite. It covers the goals and rationale behind the design choices, the hardware and software configurations used, and the details of each benchmark and its purpose. It is our hope that this new test suite will be suitable for the next several years of SSD reviews.
SSD Benchmarking: The AnandTech Heritage
To start, we need to review a bit about how SSDs work. Anand's classic articles from 2009, such as The SSD Anthology and The SSD Relapse, document many of the early challenges SSDs had to overcome on the way to taking over as the mainstream consumer storage technology. More than a decade later, those articles are still valuable background information on how today's SSDs work. All of the fundamental challenges of dealing with NAND flash memory still apply: the inability to make in-place modification to data stored in NAND flash, the disparity between NAND page sizes and erase block sizes, the need for wear leveling and the consequent performance drops when a drive is full are all still relevant. Today's SSDs are much bigger, faster and cheaper, but their controllers and firmware still need to deal with those issues. Today's SSDs also layer on some extra challenges that make their inner workings even more complicated, and require more sophisticated testing to properly assess.
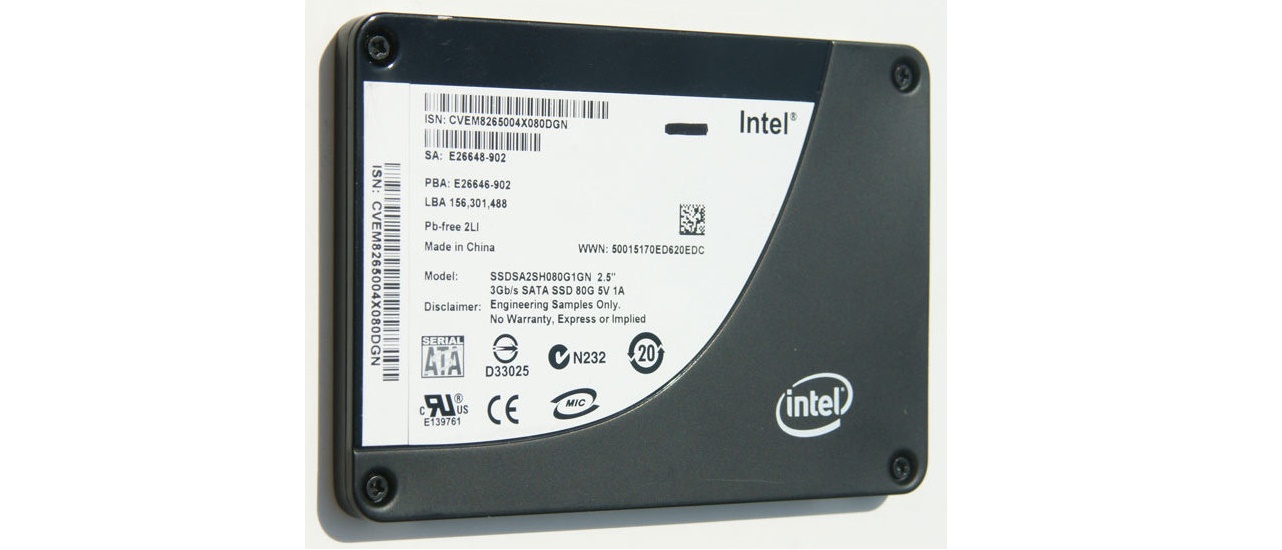
Anyone remember Intel's X25-M, using 50nm NAND?
When I started reviewing SSDs for AnandTech in 2015, TLC NAND and NVMe were only beginning to creep into the consumer market: TLC at the low end, and NVMe at the high end. Both have now taken over: MLC has all but disappeared from the market, and NVMe is the default choice for new systems. (In Micron's most recent earnings call, they shared that their client SSD shipments are now over 90% NVMe by number of bits shipped.) The higher performance allowed by PCIe and NVMe rather than SATA make stunning differences in benchmark scores, but the migration to TLC was actually more significant from the perspective of benchmark design. That's because consumer TLC SSDs rely heavily on SLC caching.
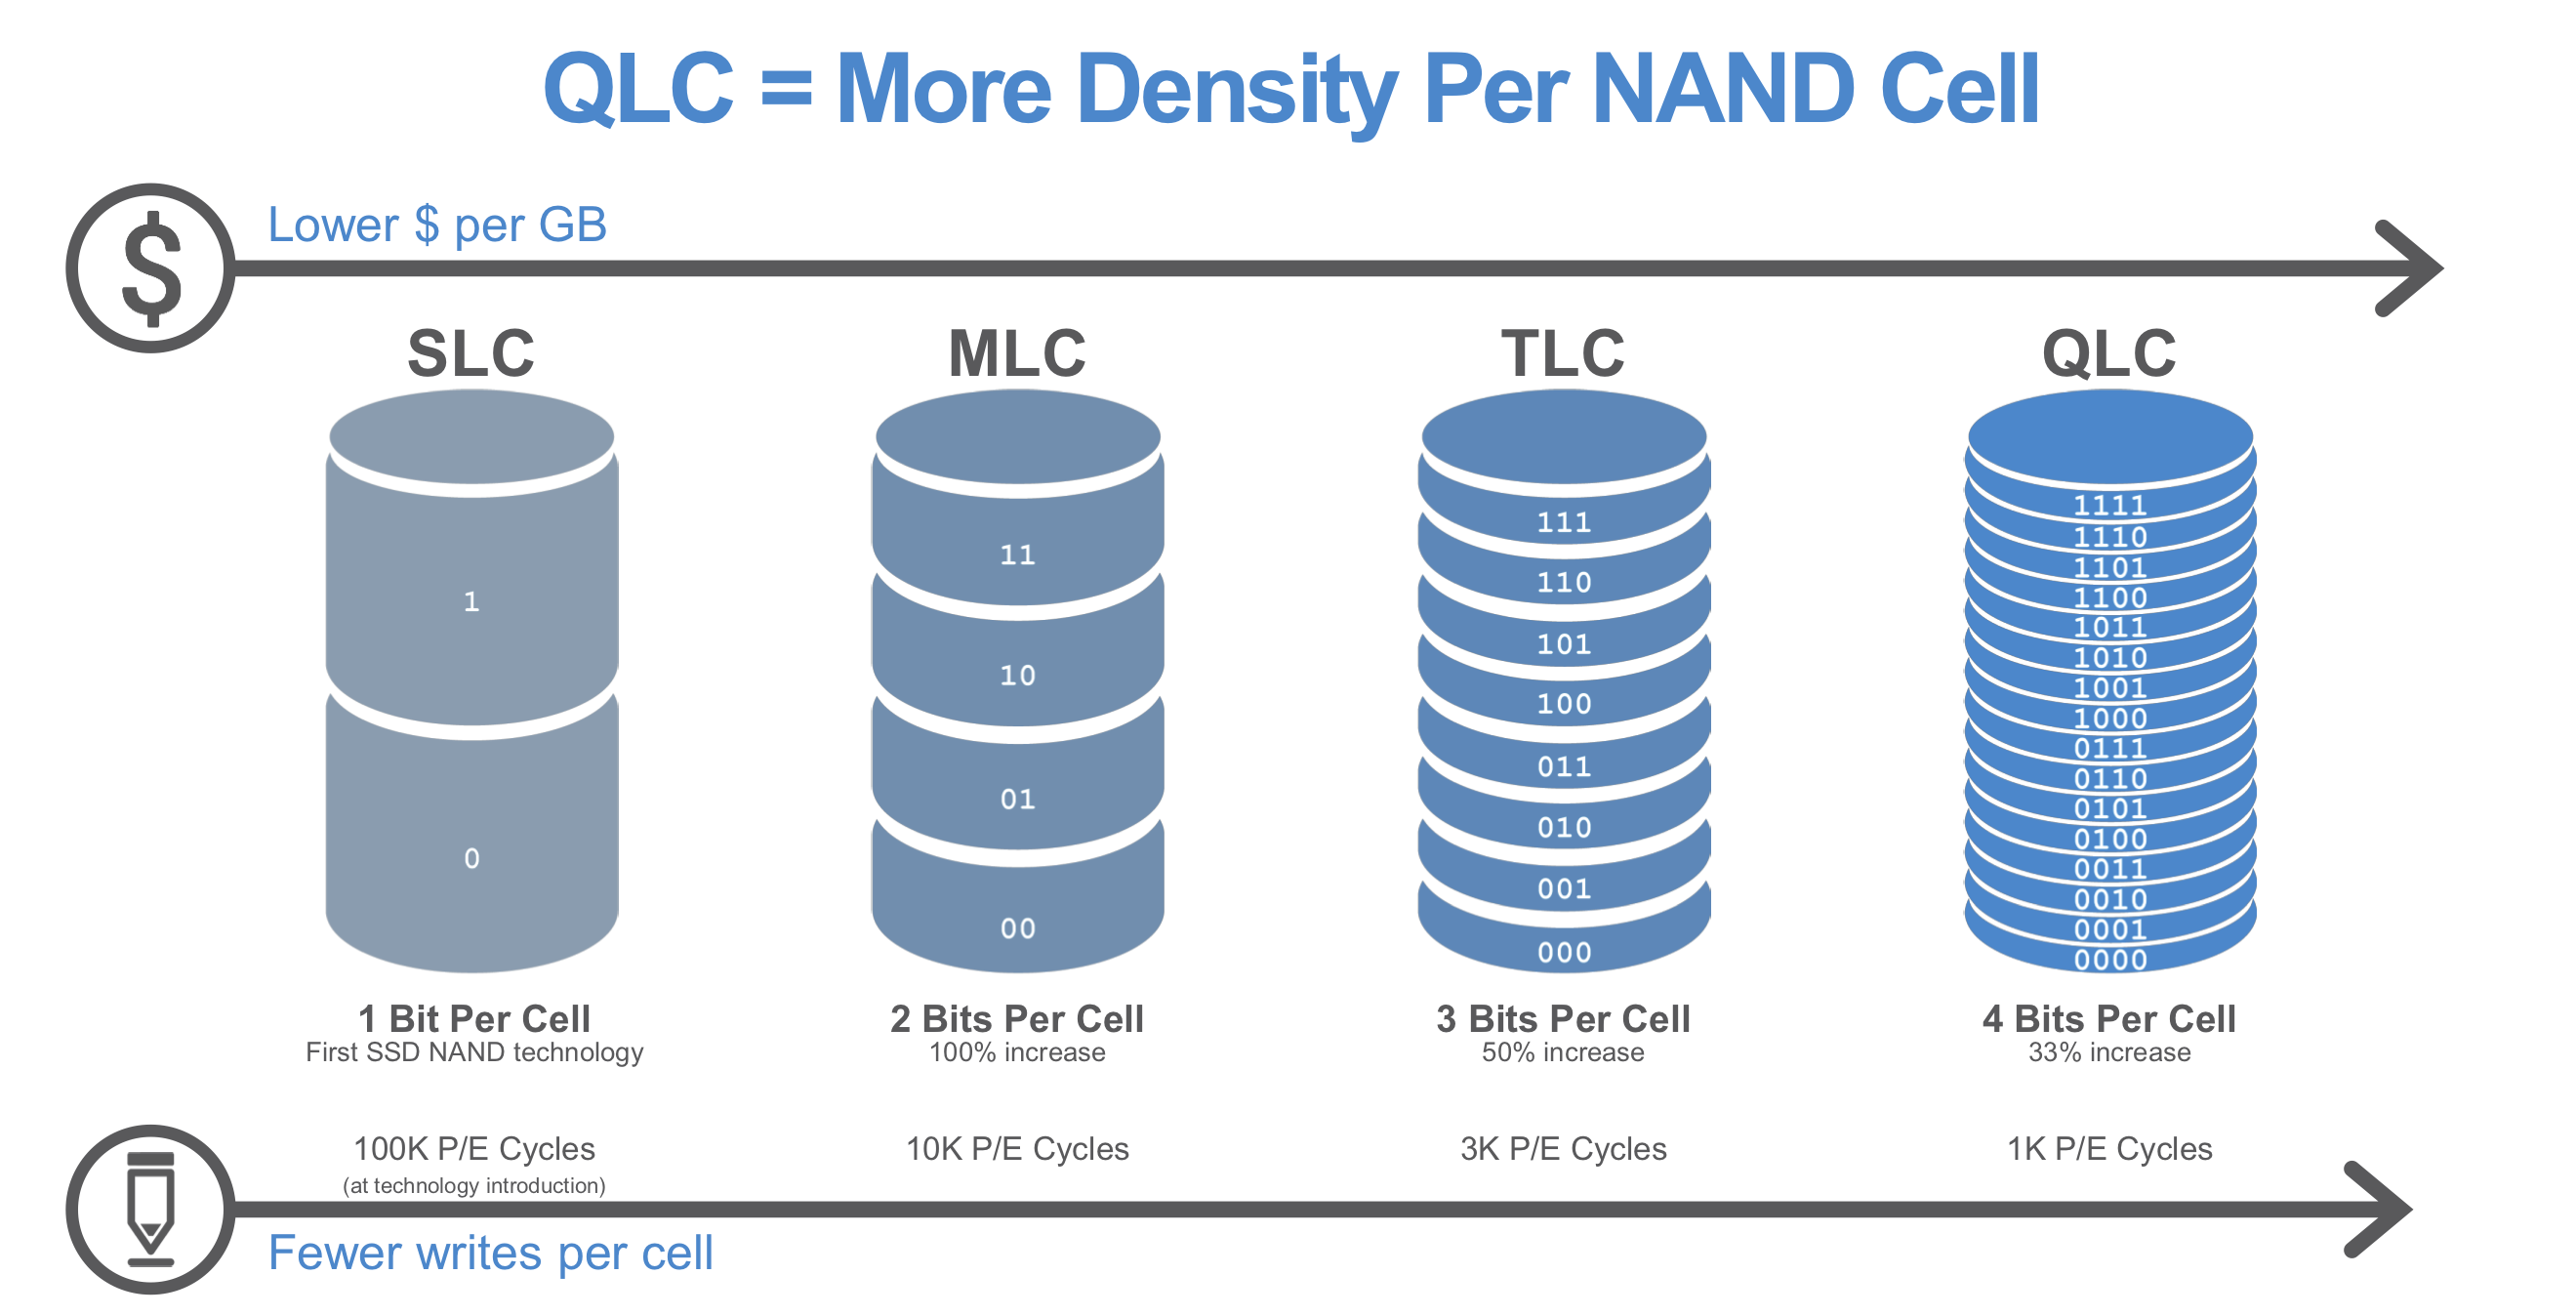
In a drive, the more bits you write to a cell, the more complex (and slower it is). Modern drives run 3 bits-per-cell, known as TLC, and 4 bits per cell, known as QLC. Both of these are slower for writes than 1 bit per cell, or SLC. By treating a portion of the drive cells as one bit per cell, known as 'SLC mode'. this allows the drive to absorb a burst of writes more quickly. This is because programming the voltage of an SLC cell can be done in one step and doesn't require as much precision as when storing multiple bits per cell.
The downside is that data written to SLC NAND must later be re-written into blocks that are operating as MLC/TLC/QLC, storing multiple bits per cell. This process (often called folding) is usually automatically performed by the drive during idle time, where latency is not important. This freee up the space in the SLC cache for future use. SLC caching is generally not used by enterprise SSDs because it makes performance less predictable and is detrimental to sustained write performance, but for client and consumer SSDs SLC write caching is now nearly universal: essentially all TLC and QLC SSDs use SLC write caching.
Modern SSDs: Always SLC Write Caching
SLC write caching has obvious implications for any benchmark that writes data to the SSD. SLC caches have a limited size, which creates two tiers of performance - one inside the cache, and one outside a cache. Most users with office-like workloads never see the 'outside-the-cache' performance. Any workload or test that writes data continuously at high speed, such as benchmark after benchmark after benchmark, can eventually overflow the cache and experience a performance drop to the lower tier of performance. Real-world consumer workloads almost never write tens or hundreds of GB continuously, especially not at extremely high speeds (ie. faster than gigabit Ethernet) - even recording uncompressed 4k60 video is a bit less than 1.5GB/s, while high-end NVMe SSDs are now offering peak write speeds in excess of 4GB/s. This is important because some SSD benchmarking involves one test followed by another then by another - enabling a more real-world use case, with adequate breaks for the drive to free up the SLC cache during idle, makes the test more relevant to lots of users.
SLC cache sizes are also variable on many drives, with the available cache size shrinking as the drive fills up. Thus a user with a 75% full SSD might only have 10% of the regular SLC cache size when the drive is empty. Drive vendors are increasingly choosing to configure SSDs to use as much space as possible for the SLC cache. Tests that operate with a mostly-empty drive can exaggerate the benefits of SLC caching as compared to what users experience when they actually use most of their SSD's advertised capacity. QLC SSDs have also introduced another complication to SLC caching, because they don't use the cache just for write operations. A typical TLC SSD will start clearing out the cache almost as soon as host IO activity ceases, trying to make the most of the idle time to prepare for future bursts of writes. By contrast, the more common behavior for QLC SSDs seems to be leaving data in the SLC cache until the cache is nearly full, so that recently-written data can be accessed again with low latency—and perhaps avoiding some unnecessary re-writes for data that turns out to be short-lived.

NVMe SSDs (and the rare SATA drive) have also made temperature a potential concern. M.2 SSDs drawing over 5W at peak can get quite hot, and it is now common for enthusiast-oriented SSDs and desktop motherboards to provide heatsinks for M.2 drives. During ordinary use, thermal throttling is seldom a problem because real workloads can't keep a fast SSD busy continuously, but it is also fairly easy for benchmarks to trigger. The synthetic benchmarks we were using up to about four years ago tested each IO pattern (random read, sequential write, etc.) for three minutes at each queue depth, for 18 minutes of uninterrupted IO per test. That's enough to trigger thermal throttling on any drive that's prone to overheating, and for the write tests to overflow the SLC cache on most drives. That kind of test can be useful for studying how a drive behaves under extreme conditions, but it doesn't say much about how it would perform in normal use.
Limiting benchmark duration isn't always enough to ensure that a test doesn't go overboard. The huge performance disparities between SATA and PCIe 4.0 NVMe SSDs mean that a 10-second test that makes sense for a SATA drive could end up forcing a NVMe drive to do more than ten times as much work. For this reason, our synthetic benchmarks put limits on both running time and the amount of data transferred by each test, helping to keep the tests more realistic and more practical.
SSD Data: Locality and DRAM
There are also a few other important technological differences between high-end and entry-level consumer SSDs beyond just the choice of interface (SATA, PCIe 3.0, PCIe 4.0) and whether the drive is using TLC or QLC NAND flash memory. The next most significant difference is in how drives store and access the metadata used by the Flash Translation Layer (FTL)—information about what physical location is currently being used to store each Logical Block Address (LBA).
For at least a few years, most SSDs on the market were using the same basic technique, popularized by the Intel DC S3700: a big, simple lookup table for translating LBAs into physical memory addresses. Even though consumer SSDs still default to presenting the illusion of 512-byte LBAs for the sake of compatibility with software written for hard drives, most drives use a FTL that operates on 4kB sectors. From that fact, it only takes a little bit of math to derive that the FTL's mapping table needs just under 1GB of space to manage 1TB of NAND flash. This adds cost to a drive, which is important in a market where often the lowest cost operator wins. Including DRAM in that proportion to the amount of flash is still standard practice for high-end SSDs, but new techniques allow the drive to trade performance for that extra DRAM cost.
Most entry-level SSD controllers no longer have a DRAM interface, or at least are offered in a more compact package that doesn't have the necessary pins exposed. These DRAMless controllers and the SSDs built around them have to manage their FTL without being able to load all of it into memory at once. The controllers commonly have on-die caches with capacity in the megabytes range, and NVMe SSDs also have the option of borrowing some of the CPU's RAM through the Host Memory Buffer (HMB) feature.
There are two main downsides to SSDs that don't have full-sized DRAM buffers: First, random reads are more likely to require an extra flash read operation to fetch the mapping information before the requested data can be read. Second, drives that cannot keep the entire FTL in memory have a harder time managing wear leveling and garbage collection, so they tend to suffer greater performance drops under write-heavy workloads and when nearly full.
The New 2021 SSD Benchmark Suite
For our new suite, the nature of the new elements of the SSD market have been taken into account in our testing. While we have been cognizant of all the issues listed above in our previous testing, the need for new tests to indicate why certain design choices affect the performance of the drive, and what it means to end-users is always a critical element that needs updating and examining regularly.
Example Drives
To illustrate our new SSD test suite, we're using 1TB SSDs from a range of market segments. Some of these we have previously reviewed, but since this is a new test suite this is also a fresh look at all of these drives. Starting from the high end:
- Samsung 980 PRO: Samsung's latest NVMe flagship is their first consumer PCIe 4.0 model, and also their first PRO model to use TLC NAND instead of MLC.
- Silicon Power US70: This is one of many drives using the Phison E16 controller and TLC NAND. That combination is what first introduced PCIe 4.0 to the consumer SSD market in 2019, but is now in the process of being replaced by the Phison E18 controller.
- Kingston KC2500: This PCIe 3.0 drive uses the Silicon Motion SM2262EN controller, which is tuned for aggressive SLC caching and usually offers best in class performance at low queue depths.
- SK hynix Gold P31: The benefits of vertical integration are on display as the matched combination of a cutting-edge (albeit still PCIe 3.0) controller and NAND allow this 4-channel drive to perform on par with 8-channel drives while setting records for power efficiency.
- Mushkin Helix-L: This budget-oriented NVMe drive uses TLC NAND and cuts costs with a DRAMless Silicon Motion SM2263XT controller that uses the NVMe Host Memory Buffer feature to borrow up to 64MB of the PC's RAM.
- Corsair MP400: Representing the other main category of budget NVMe drives, the MP400 pairs cheaper, slower QLC NAND with the Phison E12S 8-channel controller, a significant improvement over the 4-channel Silicon Motion SM2263 used by early QLC NVMe drives like the Crucial P1 and Intel 660p/665p. The MP400 has a DRAM cache, but only 512MB rather than the 1GB that would be found on a typical mainstream or high-end drive.
- Samsung 870 EVO: Samsung's brand-new TLC SATA SSD combines their latest generation 3D NAND and controller. We'll be taking a closer look at both the 1TB and 4TB models in a separate review.
- SK hynix Gold S31: Launched in late 2019 with 72-layer TLC, this is a fairly generic mainstream SATA drive with better than average efficiency, slightly slower performance than leading SATA drives, and consistently decent pricing.
- Samsung 870 QVO: This second-generation QLC SATA drive uses the same top-notch controller as the 870 EVO, so its downsides are entirely due to the slower, cheaper QLC NAND flash memory.
A new test suite means we're starting with a clean slate of benchmark results. Updated software and hardware means that even for the tests that are similar to what's in our previous test suite, the new scores are not directly comparable to older scores. Our previous batch of SSD benchmark scores has been archived in the SSD 2018 section of Bench, and a new SSD 2021 section has been started. We'll be continually updating that as new and old drives run through the new test suite in preparation for future reviews.
The test suite itself is also likely to expand a bit more, with application benchmarks and potentially a few more synthetic tests in the works. This article will be updated whenever new benchmarks are added to the test suite, so that this will still be an up to date reference on the how and why of our SSD testing.
In the meantime, we are open to feedback about the new test suite. We're collecting a lot more data from drives than we have in the past, and we'd be happy to receive suggestions for the best way to present that data in reviews. Now that the new test suite has launched, we'll be catching up on reviews of the latest and greatest SSDs while fine-tuning the new review format.
Over the next few pages, we will go over the new tests (and the results).
Storage Benchmark Considerations
Storage benchmarks can be classified into three main categories, each of which serves a different purpose.
Application Benchmarks
Application benchmarks involve real programs and measures performance as perceived by the user. As compared to other benchmark types, a well-designed application benchmark provides the best assessment of overall system performance. In principle, there's nothing really storage-specific here: you can pick any one component to swap out while holding the rest of the system configuration constant, and end up with a valid test.
An application benchmark can be as simple as performing a common task (eg. booting the OS, launching a game) while using a stopwatch. But that kind of testing is labor-intensive and error-prone. A good suite of automated application benchmarks is a lot of work to assemble. Well-known application benchmark suites include UL's PCMark and BapCo's SYSmark, which represent relatively light desktop usage. The tests don't occupy much disk space and don't perform all that much IO in aggregate. They are also almost completely devoid of the kinds of bursts of intense IO that are where fast storage pays off. As a result, these tests show very little difference in overall scores between the fastest and slowest storage configurations. This is an accurate assessment, but only for the kinds of storage-light workloads represented by these tests.
Additionally, application benchmarks have a fundamental limitation: they tell you almost nothing about why one drive ends up performing better or worse than another. This makes it impossible to reliably extrapolate application benchmark scores to dissimilar workloads. PCMark and SYSmark scores can't help you predict how your system will perform when you start launching lots of virtual machines and filling up the drive.
IO Traces
Storage IO traces are a live recording of the read and write operations performed by a real-world workload. Every read and write operation is logged along with its timestamp, the size of the data transfer and the disk sectors involved. This can add up to quite a bit of data, even when the contents of the data transfers are not logged (ie. the trace only specifies that a 1MB write was performed, but doesn't actually save a copy of that MB of data). IO traces can be analyzed in depth after the fact to see what kind of queue depths were involved, how much IO was sequential vs random, etc. Statistics can also be computed for a subset of the IO operations logged, such as analyzing read operations and write operations separately.
Recorded IO traces can also be played back, replicating the original IO patterns in a highly repeatable manner, and without needing to re-run the applications that originally generated the IO workload. This takes CPU, RAM, and GPU speed largely out of the equation, so it's easier to compare storage performance across different machines. Benchmarks built around storage trace playback focus specifically on storage performance rather than overall system performance/responsiveness, so their scores can exaggerate the performance differences between hardware configurations, as compared to using metrics that measure overall system performance.
Since trace-based storage benchmarks allow a much greater depth of analysis than application benchmark scores, they can provide insight into what specific performance characteristics enable one drive to provide better application-level performance than another.
Synthetic Benchmarks
Lastly, synthetic benchmarks for storage consist of IO patterns generated and measured by special-purpose tools: for example, using CrystalDiskMark to measure 4kB random read performance at a particular queue depth. In one sense, these test are the simplest to describe and understand (at least if the test configuration is relatively simple). However, their relevance to the real world is not so simple. It's easy to configure a synthetic benchmark that is reliable, repeatable, and says nothing useful about real-world performance. This is done deliberately by PR departments, but can also happen accidentally. And changes in SSD technology can make formerly-useful synthetic tests invalid for use on newer drives. On the other hand, sometimes we can use deliberately unrealistic synthetic tests to infer things about the internal workings of a SSD. It's also theoretically possible to configure a synthetic test to generate a workload that statistically resembles real-world IO patterns, with a varied mix of IO sizes, queue depths, and idle times—but it's usually easier to use a trace-based benchmark for this purpose.
Operating Systems
At least until Microsoft delivers DirectStorage for Windows, Linux is the best OS choice for pushing the performance limits of storage hardware with low software overhead. But more importantly, Linux offers much greater transparency and control over hardware, which is what allows us to perform highly automated testing including trying out all the different power management options supported (or not) by SSDs. The synthetic benchmarks in this test suite are all conducted using the Flexible I/O tester (Fio) version 3.25 running on Linux. This tool is very deserving of its name: the dizzying array of options allows it to be used to test all kinds of IO patterns, and this test suite only scratches the surface of what's possible.
Our trace-based tests (AnandTech Storage Bench, and PCMark 10's Storage tests) are Windows-based tests, and any application benchmarks that we make a regular part of our test suite will also be Windows-based. We're using Windows 10 version 20H2.
Testbed Hardware
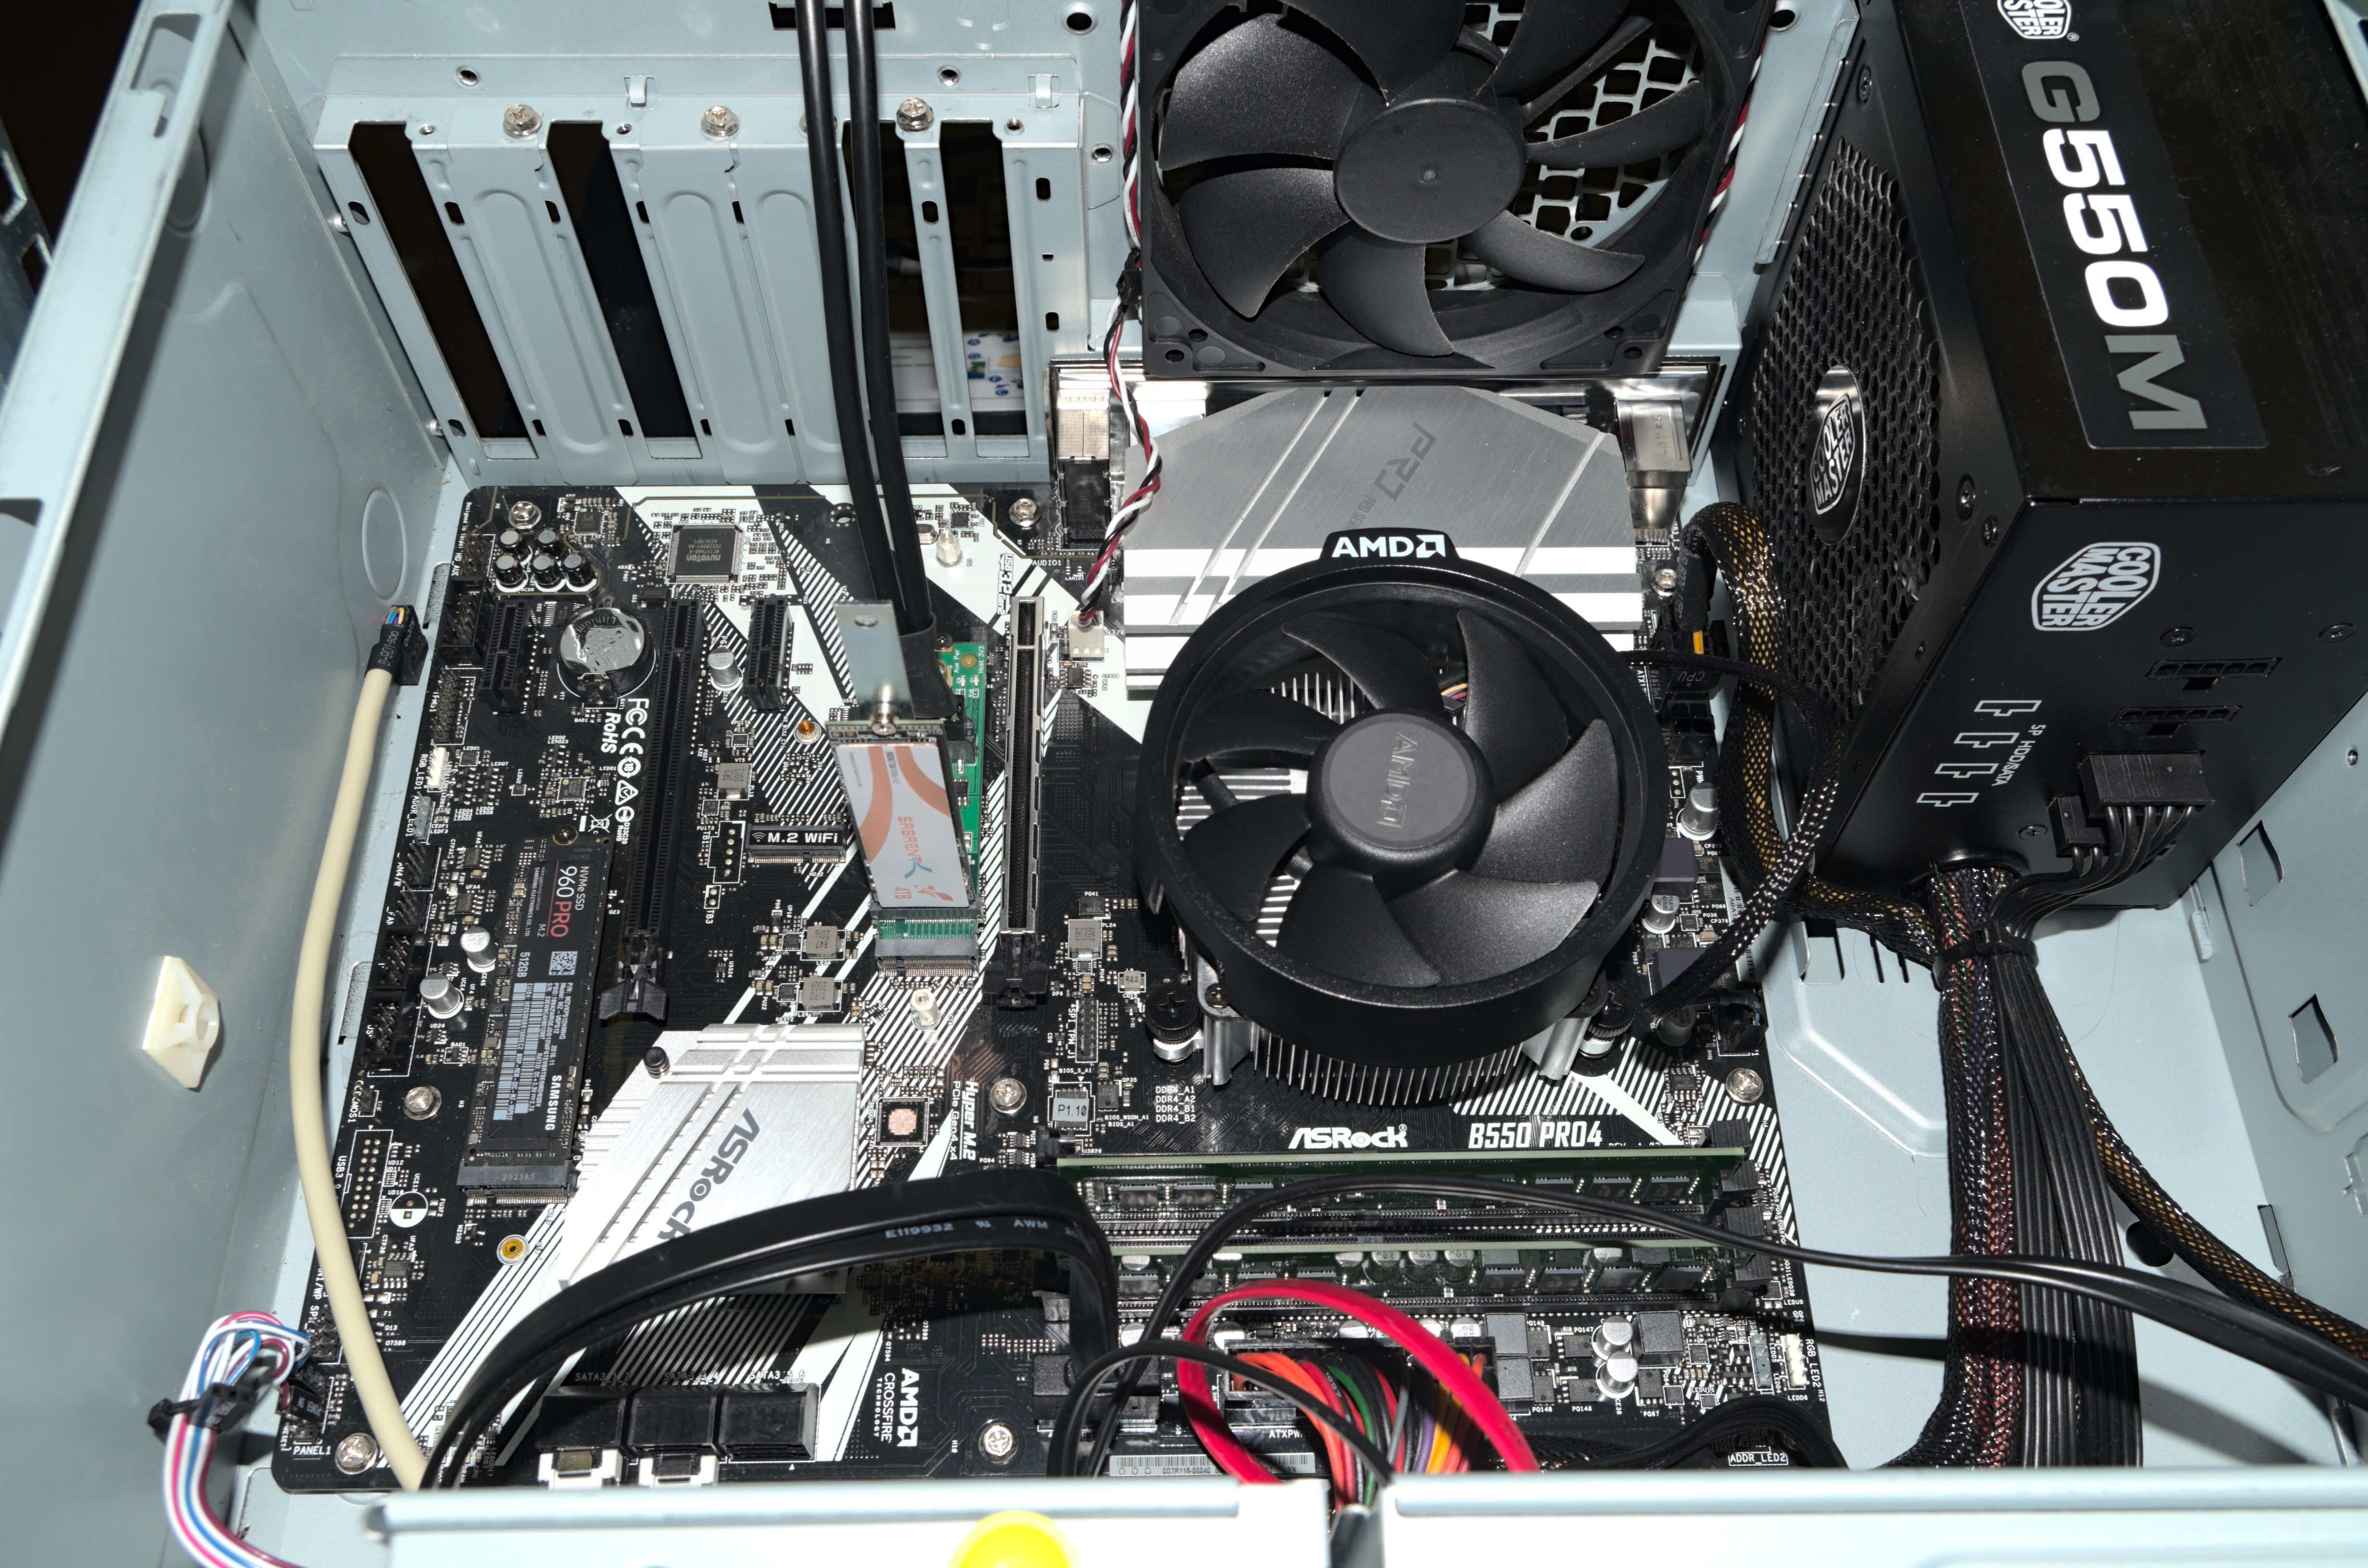
Most of our new SSD test suite makes use of an AMD Ryzen-based desktop with relatively moderate specs, but providing the PCIe 4.0 support necessary for the latest generation of NVMe SSDs. Our synthetic and trace-based don't require much compute power, so this system gets away with a 6-core processor, B550 chipset, and no GPU—leaving both the PCIe x16 and M.2 slots connected directly to the CPU available for testing at PCIe 4.0 speeds. The boot drive is a Samsung 960 PRO in the M.2 slot that is connected through the B550 chipset and therefore limited to PCIe 3.0 speeds.
| AnandTech 2021 Consumer SSD Testbed | |
| CPU | AMD Ryzen 5 3600X |
| Motherboard | ASRock B550 Pro BIOS L1.42 |
| Memory | 2x 16GB Kingston DDR4-3200 |
| Software | Linux 5.10, FIO 3.25 Windows 10 version 20H2 |
We also have a more high-end Ryzen desktop, provided by Western Digital along with their SN850 SSD. This one uses AMD's 16-core Ryzen 9 3950X, slightly faster RAM, and includes a Radeon RX 580 GPU. Our plan is to use this system for application benchmarks like PCMark 10 and SYSmark 25, but at the moment we are unable to get either one of those tests to reliably run to completion on this system when using recent builds of Windows 10. Once we can find a stable and reasonably up-to-date software and driver configuration for this system, we'll also try using it for some game loading time benchmarks. This system is also planned to be our new enterprise SSD testbed, taking over from our dual-socket Intel Skylake 2U server which is still overkill for most of our storage tests, but lacks PCIe 4.0 support.
| AnandTech 2021 Consumer SSD Testbed - Application Benchmarks | |
| CPU | AMD Ryzen 9 3950X |
| Motherboard | ASUS ROG Crosshair VIII Hero |
| Memory | 2x 16GB Mushkin DDR4-3600 |
| GPU | AMD Radeon RX 580 8GB (XFX) |
Neither of our new Ryzen testbeds is capable of using the lowest-power PCIe Active State Power Management (ASPM) modes that laptops rely on, so our idle power measurement tests remain on an older Intel Coffee Lake desktop, updated with the latest software, firmware and microcode.
| Coffee Lake SSD Testbed for Idle Power | |
| CPU | Intel Core i7-8700K |
| Motherboard | Gigabyte Aorus H370 Gaming 3 WiFi BIOS F14d |
| Memory | 2x 8GB Kingston DDR4-2666 |
| Software | Linux 5.10, FIO 3.25 |
Almost all components of these testbeds are run of the mill desktop hardware. To measure power consumption of individual drives, we also have some highly specialized equipment provided by Quarch Technology. Their HD Programmable Power Module is a power supply that provides simultaneous measurement of voltage and current on its 12V and 5/3.3V supply rails, with readings taken every 4 microseconds. The HD PPM is a bit larger than an optical disc drive, and feeds power to the SSD under test using any of several different power injection fixtures.
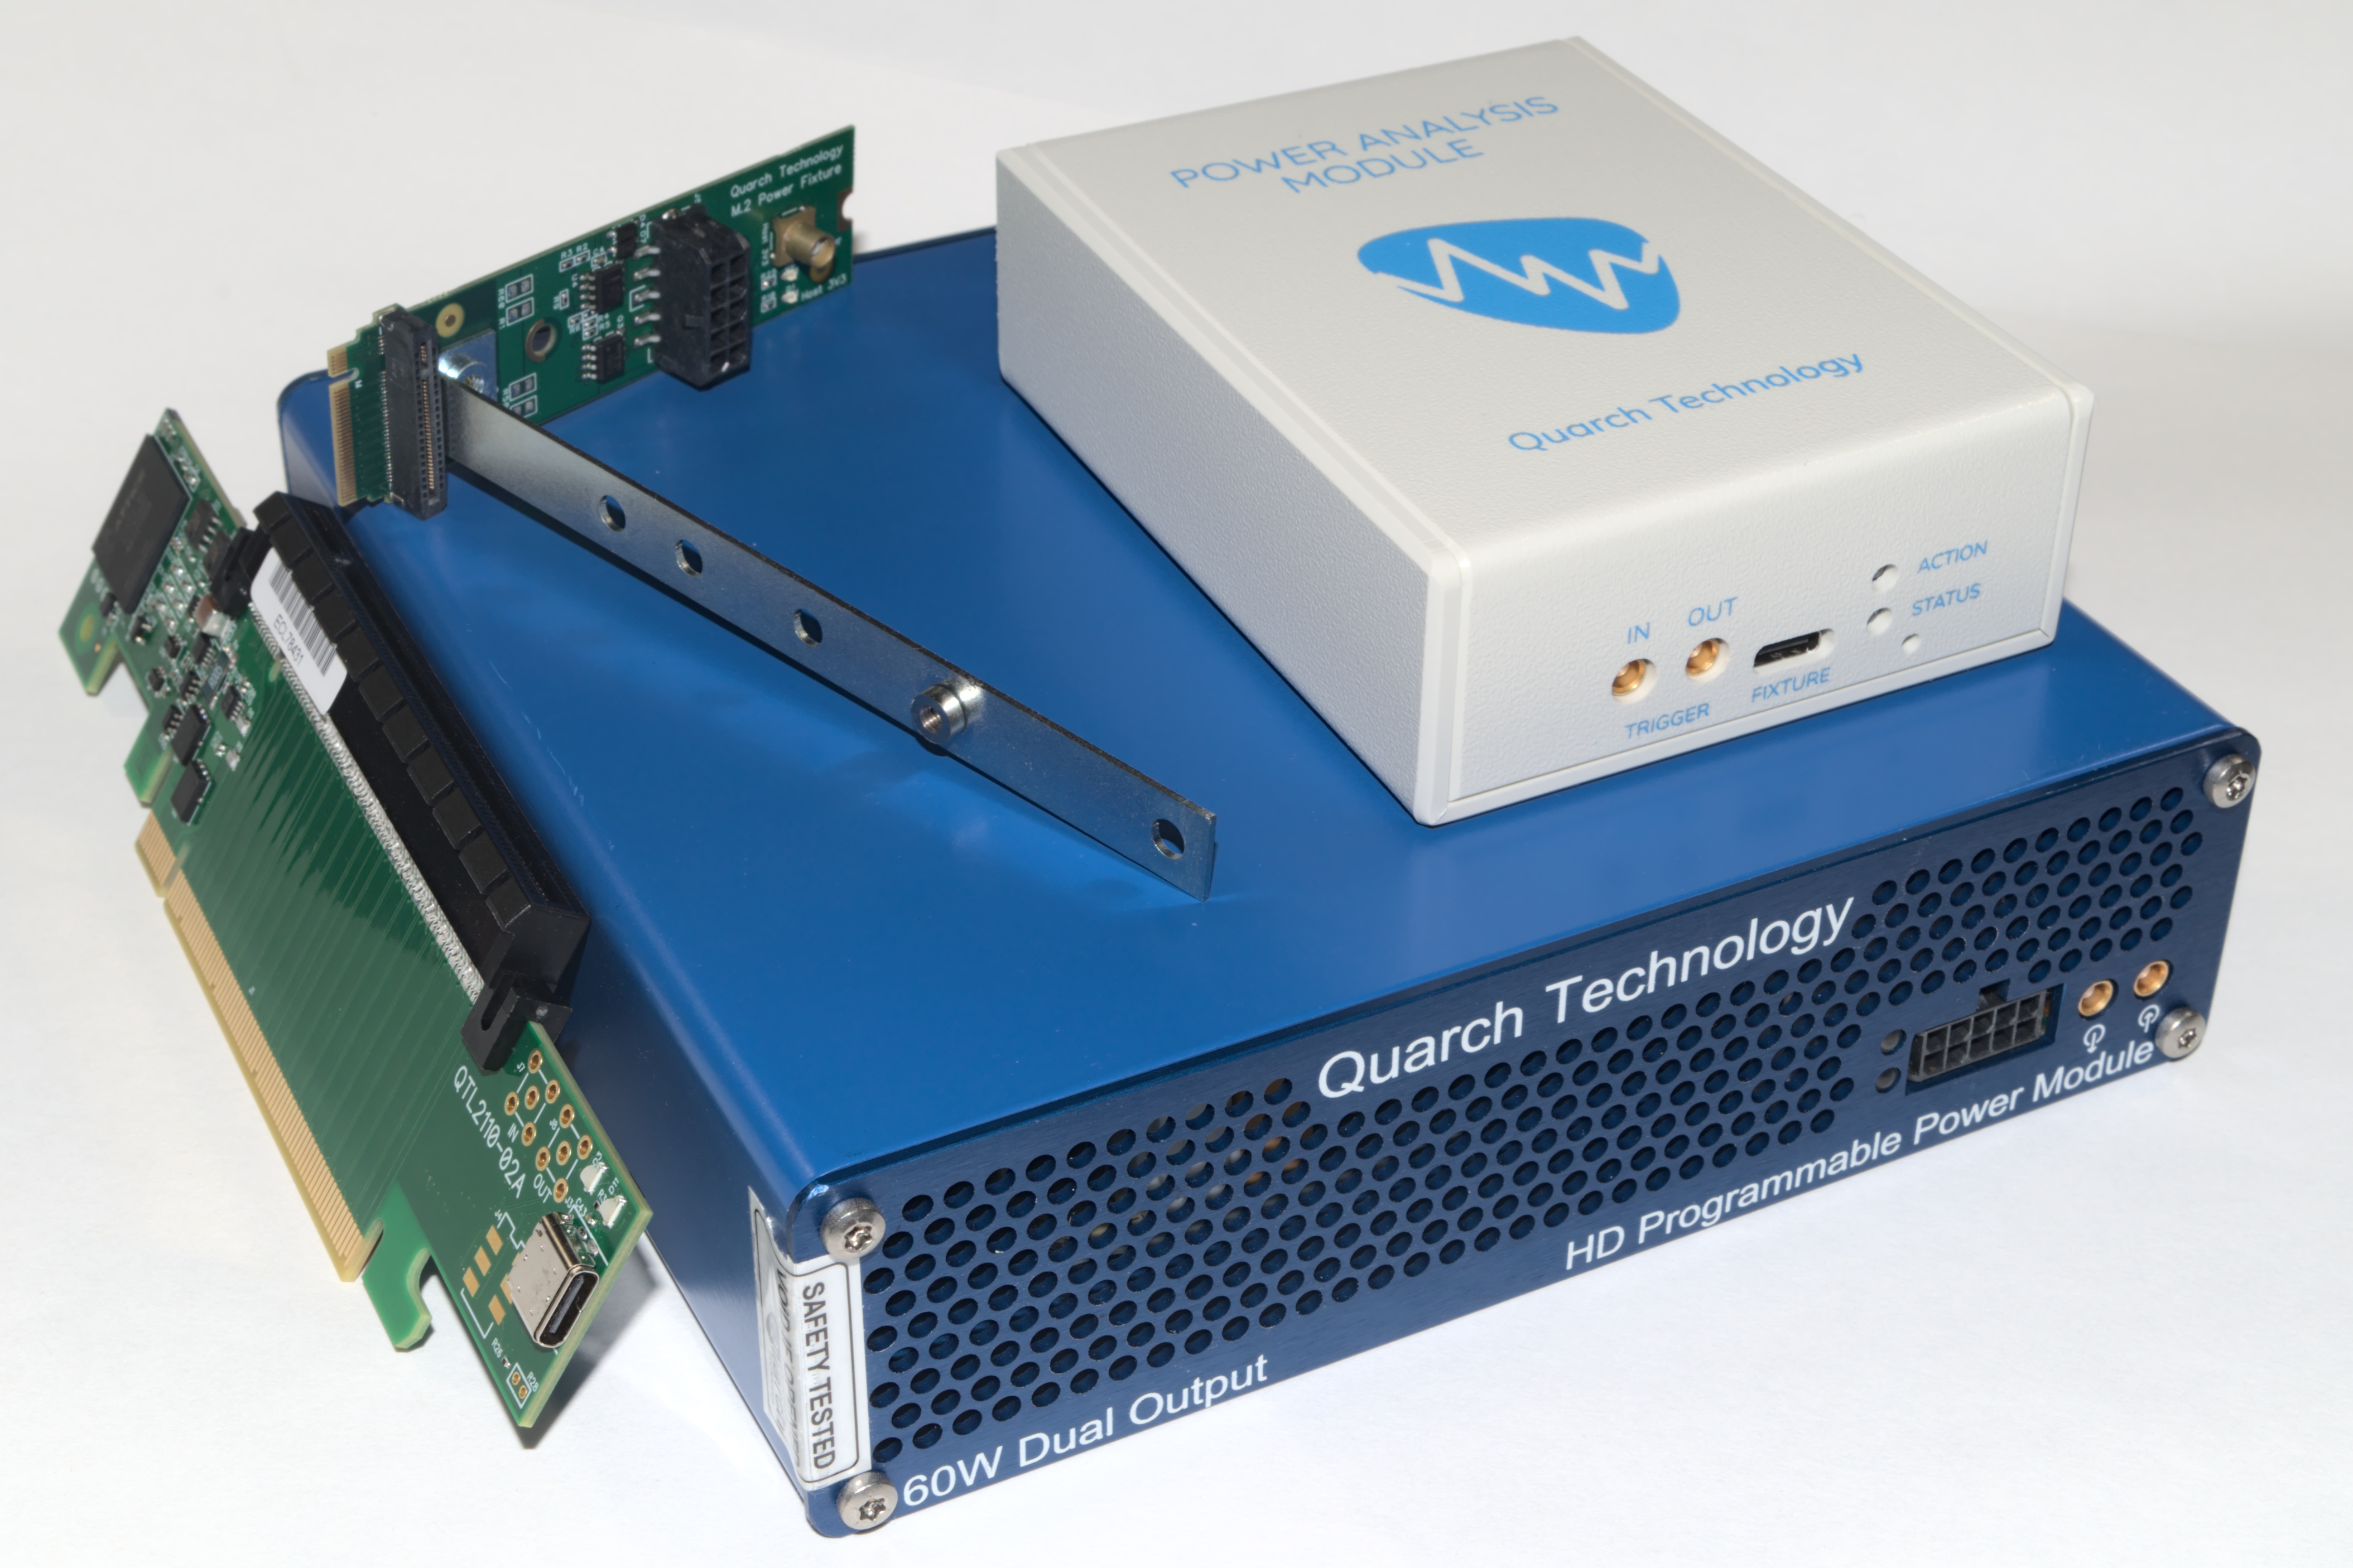
Quarch has also recently introduced the Power Analysis Module (PAM). This moves the measurement hardware (ADCs, etc.) onto the form factor-specific fixture itself, and relies on the host system to power the drive instead of the PAM serving as a power supply. We still get the same high-precision measurements, but the PAM is now a much smaller fanless box that just handles translation and buffering of the data stream.
IO Traces: AnandTech Storage Bench (ATSB)
Our in-house suite of storage traces has been a staple of our SSD reviews for almost a decade. The current versions of the AnandTech Storage Bench (ATSB) Light and Heavy tests were introduced in 2011, but soon proved to be insufficient for stressing newer SSDs that were faster and larger. The Destroyer was added in 2013 to provide a much longer and more intense test, and in 2015 we started running the Light and Heavy tests twice: once on an empty drive, and again on a full drive to show the worst-case performance drop.
While these IO traces were recorded a number of years ago, upon regression analysis to a modern environment, the mix of random vs sequential transfers are almost identical. IO patterns involved in ordinary consumer PC usage haven't changed drastically in the past decade. Downloading and installing a recent AAA video game involves a lot more total IO, but things like the mix of random vs sequential transfers are still pretty similar.
The way we have enabled recorded the tests also removes any historic limitations of queue depth limits - IO tracing at the OS level enables the capture of dozens or hundreds of IOs at once, such that playback on modern NVMe systems feel the brute force of the IO required. In practice, queue depths during ordinary desktop usage are usually in the single digits, and on fast NVMe drives like Intel's Optane SSD the queue depths experienced by the drive will tend to be even a bit lower. In the case of TRIM or flush commands, these are relatively uncommon during ordinary consumer workloads, and are often highly variable and inconsistent in their timing, and so those are not present in the test. This was more an issue with older SSDs anyway. Similarly with enterprise drives, most of which enable their own data management.
The IO traces used for the ATSB tests originally recorded the precise timing of every IO operation. During the playback process, the idle times in the trace are cut short to a maximum of 25ms each. This is necessary for the test duration to be reasonable, but it does mean that drives don't get long stretches of idle time to use for garbage collection and flushing SLC caches. But in aggregate, the drives are still spending a lot more time idle than busy: during a relatively quick 7 hour run of The Destroyer, a fast NVMe SSD will only spend a bit more than 2 hours busy with one or more pending IO operation. The rest of the time is accounted for by a very large number of short idle periods.
| AnandTech Storage Bench IO Traces | ||||||||||||||
| The Destroyer | Heavy | Light | ||||||||||||
| Reads | 38.83 million | 2.17 million | 373k | |||||||||||
| Writes | 10.98 million | 1.78 million | 460k | |||||||||||
| Total IO Operations | 49.8 million | 3.99 million | 832k | |||||||||||
| Total GB Read | 1583.02 GiB | 48.63 GiB | 17.97 GiB | |||||||||||
| Total GB Written | 875.62 GiB | 106.32 GiB | 23.25 GiB | |||||||||||
| Typical Test Duration | 7 hours (NVMe) 12 hours (SATA) |
1h 15m | 25m | |||||||||||
Aside from the updated hardware and Windows versions, the one big change we're making to how the ATSB tests are run is a change for the sake of better automation. Previously, the drives being tested were secure erased before each ATSB trace playback, and for the Light and Heavy test runs on a full drive we would erase the drive, fill it, then play back the trace. But secure erasing drives is a hassle when Windows is involved, so this meant manually rebooting to Linux five times for the five trace runs. Our new method is to run all the trace tests in sequence: starting from a freshly-erased empty drive, we run the Light test, then the Heavy and The Destroyer, then fill the drive with sequential writes and run the Light and Heavy tests again. This means that our "empty drive" test runs of the Heavy test and The Destroyer are now running on a lightly-(ab)used drive rather than a freshly-erased drive, and that may bring down the scores somewhat. The full drive run of the Heavy test will also be somewhat affected by the mix of IO performed by the preceding Light test that disturbs the preconditioning of the full-drive sequential write pass. This eases our testing process and saves my sanity somewhat.
As always, we're still giving the drives plenty of idle time (10 minutes) between test runs and after the sequential write pass. The speed of today's NVMe drives mean that the automated sequence of running all five stages of the ATSB tests now takes about the same ~12 hours that was average for a SATA drive to complete just The Destroyer. Batching the ATSB tests together makes for more effective time usage when running these tests overnight, and less sleep lost to manual intervention.
The performance scores presented for each ATSB test include the overall average throughput during the test, and several subscores breaking down average and 99th percentile latency for both read and write operations. We also report the total energy usage during the test, which is a good indication of overall efficiency. Low-power drives that take a long time to complete the test and drives that complete it quickly but with high power draw will both suffer in the energy usage rankings.
PCMark 10 Storage Benchmarks
At the end of 2019, UL released a major update to their popular PCMark 10 benchmark suite, adding storage performance tests that had been conspicuously absent for over two years. These new storage benchmarks are similar to our AnandTech Storage Bench (ATSB) tests in that they are composed of traces of real-world IO patterns that are replayed onto the drive under test.
PCMark 10 provides four different storage benchmarks. The Full System Drive, Quick System Drive and Data Drive benchmarks cover similar territory to our ATSB Heavy and Light tests, and all three together take about as long to run as the ATSB Heavy and Light tests combined. The Drive Performance Consistency Test is clearly meant to one-up The Destroyer and also measure the worst-case performance of a drive that is completely full. Due to time constraints, we are not yet attempting to add the Drive Performance Consistency Test to our usual test suite. This is a line we're put in to ensure timely arrival of reviews.
| PCMark 10 Storage Tests | ||
| Test Name | Data Written | |
| Data Drive | 15 GB | |
| Quick System Drive | 23 GB | |
| Full System Drive | 204 GB | |
| Drive Performance Consistency | 23 TB + 3x drive capacity | |
The primary subscores for the PCMark 10 Storage benchmarks are average bandwidth and average latency for read and write IOs. These are combined into an overall score by computing the geometric mean of the bandwidth score and the reciprocal of the latency score.
Full System Drive Benchmark
The Full System Drive Benchmark covers a broad range of everyday tasks: booting Windows and starting applications and games, using Office and Adobe applications, and file management. The "Full" in the name does not mean that each drive is filled or that the entire capacity of the drive is tested. Rather, it only indicates that all of the PCMark 10 Storage sub-tests are included in this test.
Quick System Drive Benchmark
The Quick System Drive Benchmark is a subset of the Full System Drive Benchmark, running only 6 out of the 23 sub-tests from the Full test.
Data Drive Benchmark
The Data Drive Benchmark is intended to represent usage a secondary or portable drive may be subject to. This test simulates copying around files, but does not simulate the IO associated with launching and running applications from a drive.
Synthetic Tests: Basic IO Patterns
Our first batch of synthetic benchmarks exercise the four basic IO patterns: random reads, random writes, sequential reads, and sequential writes. These are the figures most often quoted on SSD spec sheets, with the fine print delineating test conditions designed to produce the largest possible numbers. Our tests are intended to reflect more realistic conditions of low queue depths, though we do also include some tests that get up to very high queue depths.
The biggest change here from our previous SSD test suite is that all of these tests are now run twice: first on a mostly-empty drive with the test confined to the first 32GB of the drive, and later with the drive 80% full and the test allowed to touch any part of that 80%. The intention here is to capture some of the impact of SLC caching and DRAMless or reduced-DRAM designs. The test runs given free reign over 80% of the drive will show much less spatial locality than the 32GB range runs, so drives that do not have a full-size DRAM buffer to cache their FTL mapping tables will generally show worse random access performance for the wide-range tests. Running tests with the drive 80% full also means drives with a variable-size SLC cache will have had to shrink the cache size down to its minimum size (or very nearly), which means write tests will be much more likely to overflow what SLC cache remains. Drives that optimistically keep data in their SLC caches to accelerate reads will also tend to suffer on the wide-range tests where most of the data accessed cannot still be in the cache.
Burst IO Performance
First up, we have a series of tests at queue depth 1 measuring performance on short bursts of IO. The random read and write tests consist of 32 bursts of up to 64MB each. The sequential read and write tests use eight bursts of up to 128MB each. Each burst is limited to a maximum of one second, though that limit should only come into play for particularly slow drives.
Contrary to standard industry practice, these sequential read and write test are configured to perform 1MB operations rather than 128kB. We made this choice because disk traces show that the sequential IO produced by moving large files around with Windows results in 1MB chunks of IO, so these burst sequential IO tests are a decent proxy for simple file copying tests, and are somewhat more representative of real-world IO patterns than issuing 128kB requests one at a time. However, since these tests are run on Linux, the OS will split up these IOs into 128kB segments and issue them to the drive as a batch of 8 commands, although that doesn't much change the chunkiness of the IO. This change to 1 MB is likely to particularly benefit drives optimized for 1 MB chunks, and we've previously noticed a number of popular controllers focusing on this size for IO, despite most spec sheets only focusing on 128 kB.
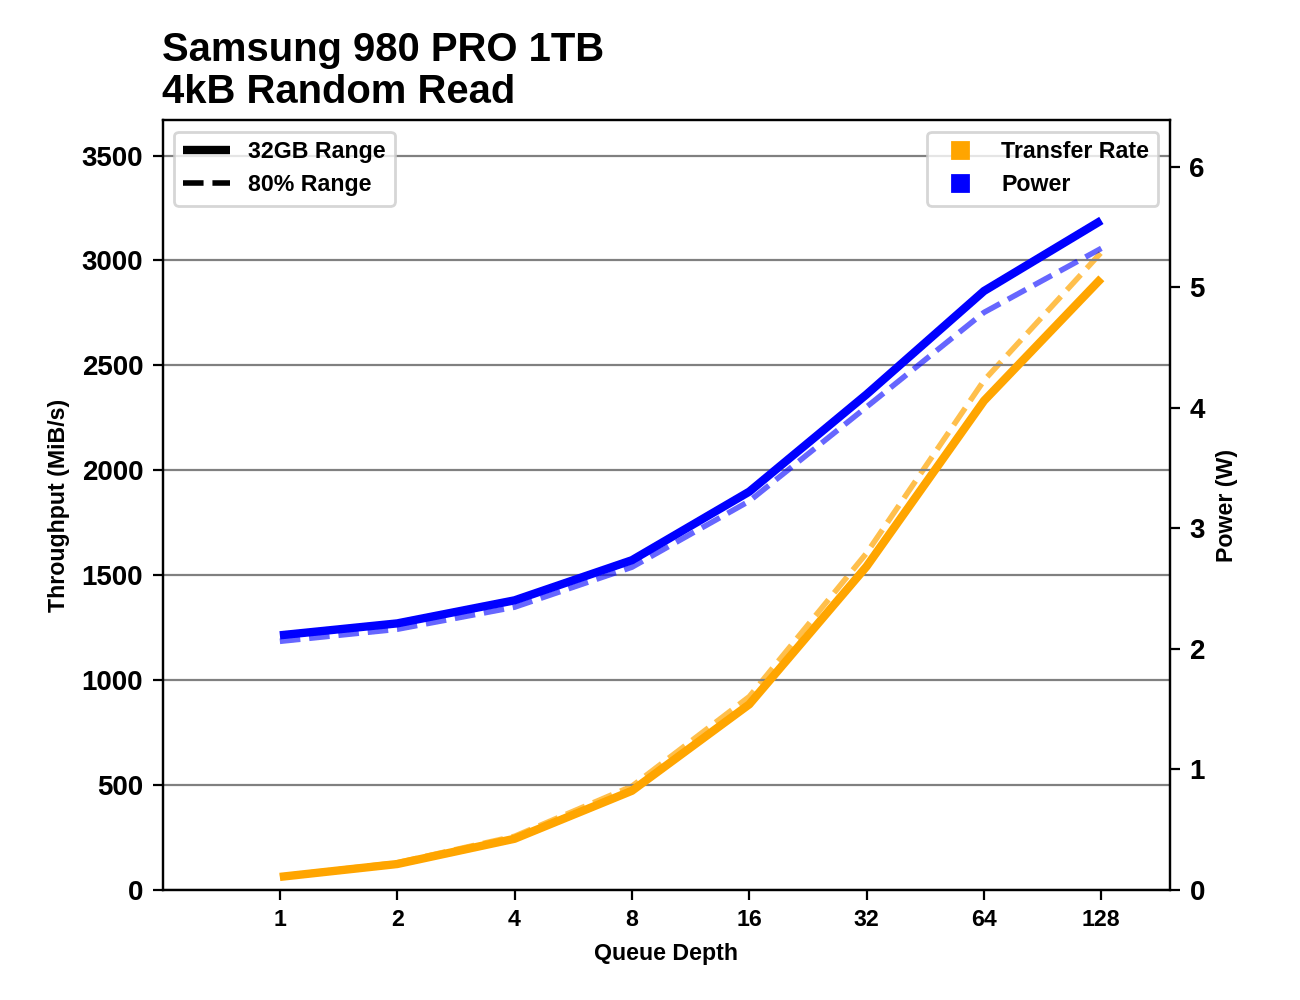
Sustained IO Performance
Our sustained IO tests have also changed a bit, aside from the split to test both narrow and wide ranges of the drive. We're still testing the four basic IO patterns at a range of queue depths (now going up to QD128), but placing the most importance on performance at the low queue depth most commonly produced by real-world usage.
Each sub-test is permitted to run for much longer than our burst IO tests, but we still place strict limits on these tests: the test for each queue depth and IO pattern is allowed to transfer up to 16GB, and to run for no more than 30 seconds (sequential IO) or 10 seconds (random IO). After each test that only reads data, the drive is given idle time equal to the duration of the test phase that just completed. After tests that write data, the idle time is five times longer, to allow for the drive's background cleanup processes to make progress. The random read and write tests are multithreaded and will use up to four threads to perform IO, so the QD32 test phase consists of four threads each operating at QD8. The sequential IO tests are all single-threaded regardless of queue depth, and move to a new random location within the test range after each 128MB of IO, in order to avoid constantly hammering the same LBAs on each iteration. (This can be thought of as representing a mild degree of filesystem fragmentation.)
Since these tests run longer than the blink of an eye durations of the burst IO tests, we're able to take meaningful power measurements, and compute power efficiency metrics (performance per Watt) for each test.
The primary scores we report for each test are an average of the measured performance/power/efficiency at queue depths 1, 2 and 4. Weighting those three equally is a fairly arbitrary choice, but we feel it does a fine job of representing a somewhat realistic distribution of queue depths.
 |
|||||||||
| Random Read | |||||||||
| Random Write | |||||||||
| Sequential Read | |||||||||
| Sequential Write | |||||||||
Digging into the detailed graphs for each drive shows that the latest high-end NVMe SSDs continue to show increased performance as queue depths climb to insane levels. We could have extended these tests far beyond QD128, but we're already well into the fantasy realm of silly benchmarks. There are also some very striking discrepancies between the narrow 32GB range testing and the 80% full drive testing, especially on the write tests.
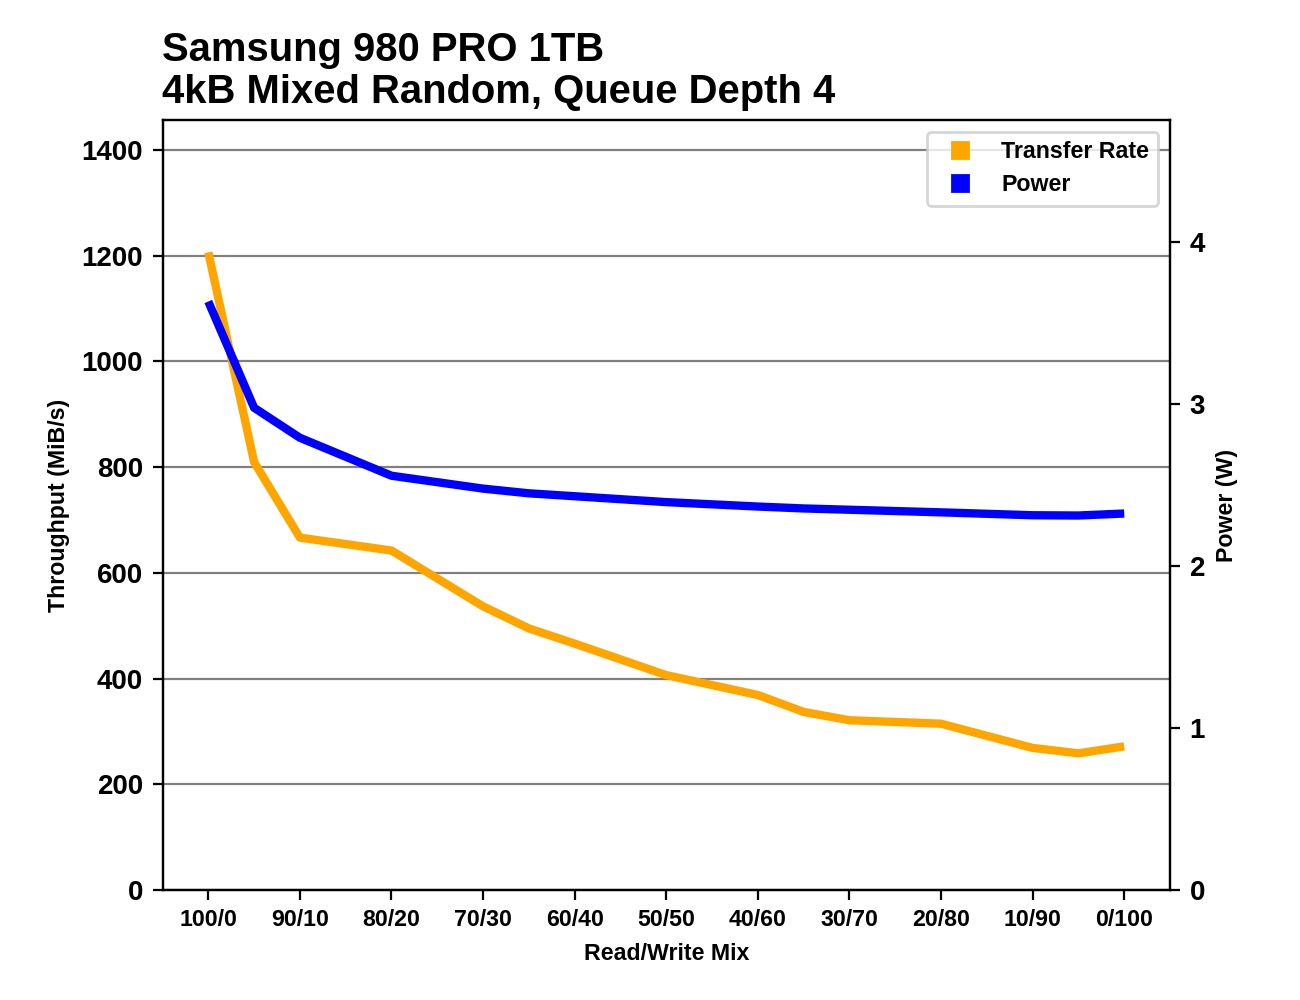
Mixed IO Performance
The trace-based tests in our benchmark suite do a pretty good job of covering realistic patterns of mixed reads and writes. These synthetic tests of varying mixes of reads and writes aren't intended to emulate any particular real-world usage, but are more about observing how performance scales as the balance between reads and writes is adjusted. Most consumer IO tends to involve more reads than writes, but these benchmarks test read-heavy and write-heavy workloads equally.
The changes to our synthetic tests of mixed read/write workloads are similar to the modifications for the other sustained IO tests. However, on this one we're not bothering to split it into versions running against a 32GB slice of the drive and an 80% full drive: the only versions here are the 80% full tests.
Both the mixed sequential and mixed random IO tests use four threads each running at QD1, for a total queue depth of 4. The mixed sequential IO test has been switched to use 1MB operations rather than 128kB, which means there's considerably more data in flight than our old 128kB @ QD1 mixed sequential IO test.
Each workload mix is tested for at most 10 seconds/16GB (random IO) or 30 seconds/16GB (sequential IO). The main scores reported here are averages across all the mixes tested. A good score usually indicates a well-rounded drive that handles write pressure well, but a poor score here doesn't necessarily translate into anything worth worrying about for a consumer.
 |
|||||||||
| Mixed Random IO | |||||||||
| Mixed Sequential IO | |||||||||
Advanced Synthetic Tests
Our benchmark suite includes a variety of tests that are less about replicating any real-world IO patterns, and more about exposing the inner workings of a drive with narrowly-focused tests. Many of these tests will show exaggerated differences between drives, and for the most part that should not be taken as a sign that one drive will be drastically faster for real-world usage. These tests are about satisfying curiosity, and are not good measures of overall drive performance.
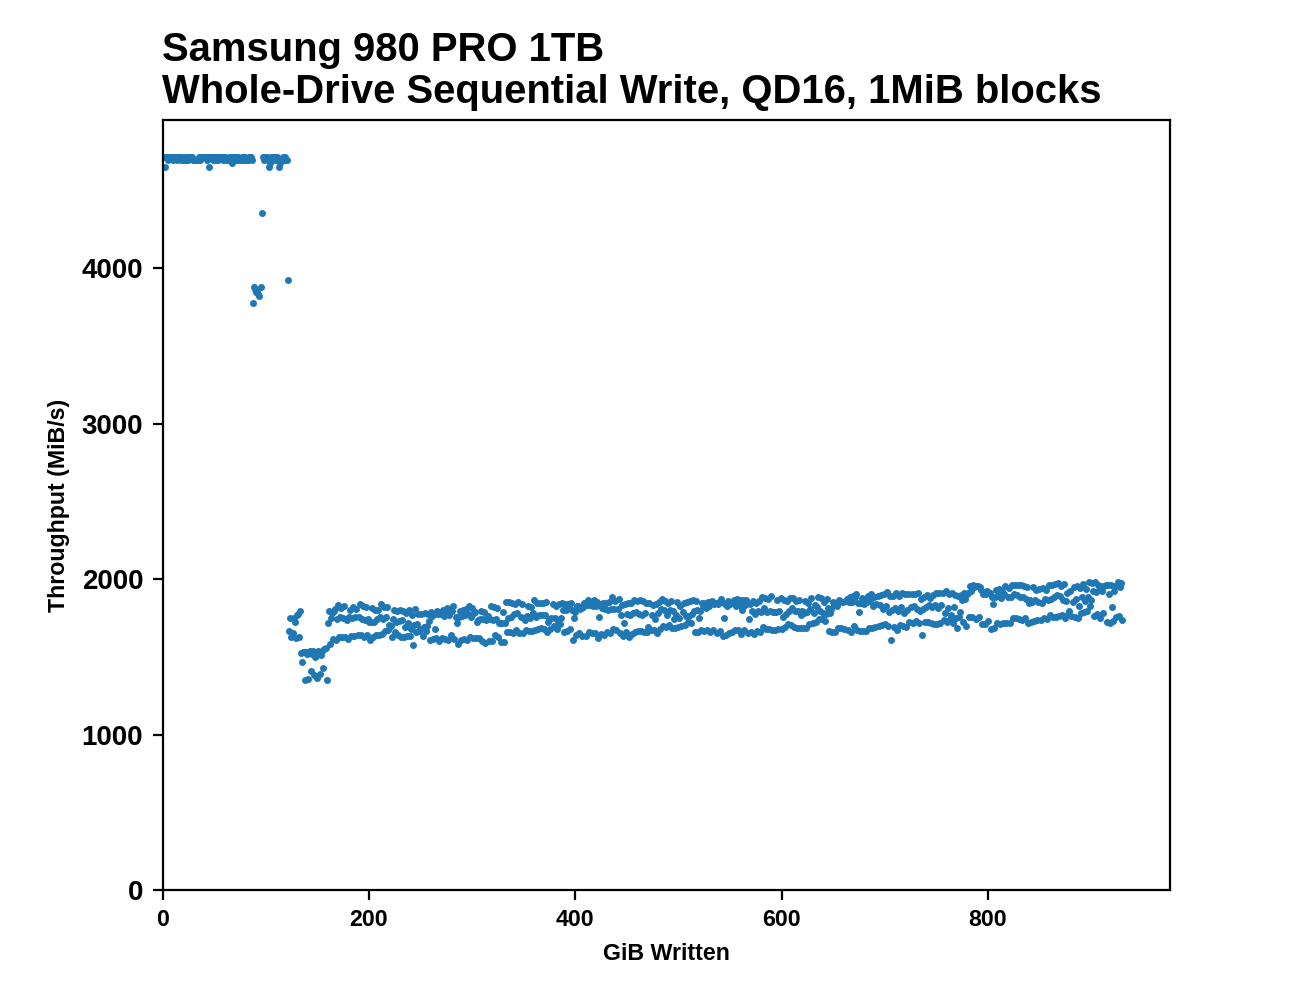
Sequential Drive Fill
The main purpose of the sequential drive fill tests are to estimate the size of a drive's SLC write cache. This test is also one of the most likely to trigger thermal throttling, because it is the longest-running sustained IO test in our suite. This test performs two passes of writing to the drive. The first is conducted after erasing the drive and giving it a few minutes to cool down and finish any background work. This first pass of sequential writes shows us the best-case SLC cache capacity, since any variable-sized cache will be at its largest when starting on an empty drive. The second pass is conducted after giving the drive some idle time and performing some read performance tests. By the time the second write pass begins, the drive should have finished any background work and we should observe the worst-case SLC cache capacity for drives that have a variable size cache.
As the second sequential write pass continues, the SLC cache will eventually be filled and even drives that don't use SLC caching will usually show some performance drop. This is pushing the drive well beyond the limits of any real-world consumer workload, so aside from any SLC cache at the beginning, performance during the second pass is irrelevant. However, since this second pass is overwriting data that was also written sequentially, the drive's garbage collection during this process is quite straightforward. Overwriting the drive with random writes instead of sequential writes would be more likely to fill the drive's spare area and induce more severe performance drops.
 |
|||||||||
| Pass 1 | |||||||||
| Pass 2 | |||||||||
After both passes of sequential writes are complete, the last 20% of the drive is TRIMed and the drive is given plenty of idle time. This prepares the drive for the battery of tests that are conducted on an 80%-full drive—full enough that SLC cache size is significantly reduced, but still leaving some empty space to avoid testing the absolute worst-case scenario of performance on a completely full drive.
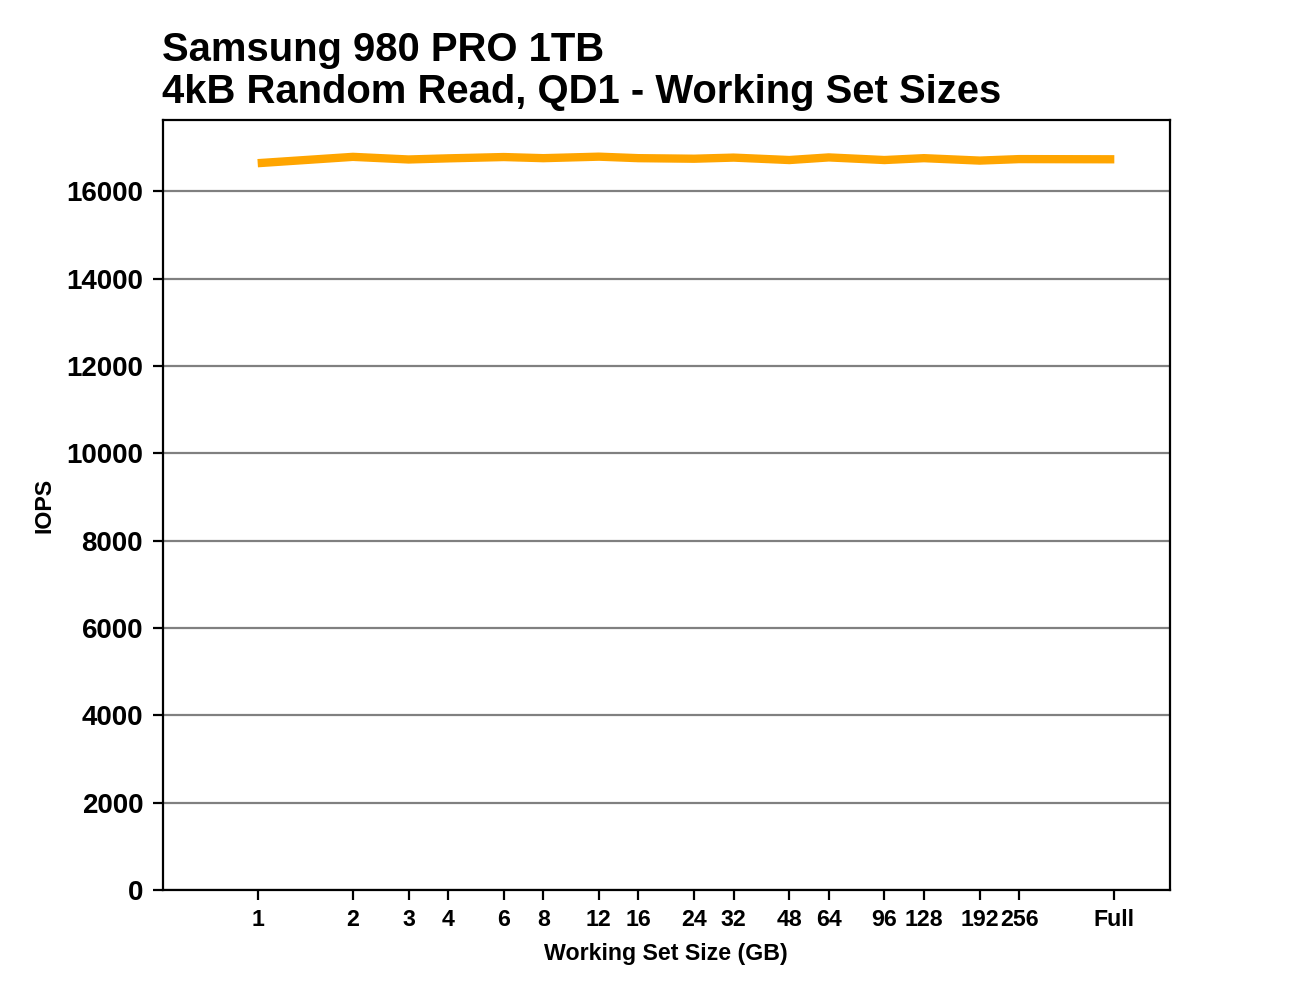
Working Set Size
This test performs random 4kB reads at queue depth 1 while varying the working set size: the size of the dataset that the random reads are coming from. When the working set size is small, the access pattern has a high degree of spatial locality, and DRAMless drives should have no trouble caching the limited amount of NAND mapping information needed to handle the reads. As the working set size increases, drives with little or no RAM are likely to show reduced performance from an increasing number of FTL cache misses. Often there is a sharp drop in performance that suggests the size of any on-controller SRAM or HMB cache in use. Drives with some DRAM but not the full 1GB per 1TB ratio may be able to handle very large working set sizes with good performance, but typically still show reduced performance when random reads span the entire drive.
 |
|||||||||
This test also provides an opportunity to verify that the TRIM command is working properly: when attempting to read data from a portion of the drive that is empty (or has been trimmed), the drive should return a bunch of zeros as soon as it has looked up the relevant LBAs in the FTL and determined that there isn't actually any real flash memory currently allocated to those addresses. So in addition to running the working set size test on a full drive, we also run it when the drive is 32GB full and 80% full, expecting to see substantially increased performance when many or most of the reads should be handled without actually touching the NAND flash memory. These extra test runs aren't included in the graphs we publish, but we're keeping an eye out for drives that don't behave as expected.
Power Management
Idle power management for SSDs can be surprisingly complicated, especially for NVMe drives. But it is also vitally important for any battery-powered system. Real-world client storage workloads leave SSDs idle most of the time, so idle behavior is a big factor in how battery-friendly a drive is. Power draw when idle isn't the only thing that matters; how quickly a drive can enter or wake up from a low-power state can have a big impact on how effective its power management is.
For SATA SSDs, the host system doesn't have a lot of say in how the drive manages power. Using the SATA Aggressive Link Power Management (ALPM) feature to mostly power the SATA connection is usually sufficient to put a drive to sleep. But the lowest-power sleep state supported by SATA devices (DevSleep) requires extra signalling on a pin that's part of the SATA power connector. This means that DevSleep is in practice only supported on laptops, and our desktop testbeds cannot use or measure this sleep state.
NVMe includes numerous features pertaining to power management or thermal management. Most of them are optional in the NVMe spec, but there's a common subset supported by most consumer SSDs. NVMe drives can support numerous different power states, including multiple active and multiple inactive power states. The drive's firmware provides information about its capabilities to the host system:
| Samsung 980 PRO NVMe Power States |
|||||
| Controller | Samsung Elpis | ||||
| Firmware | 1B2QGXA7 | ||||
| Power State |
Maximum Power |
Active/Idle | Entry Latency |
Exit Latency |
|
| PS 0 | 8.49 W | Active | - | - | |
| PS 1 | 4.48 W | Active | - | 0.2 ms | |
| PS 2 | 3.18 W | Active | - | 1.0 ms | |
| PS 3 | 40 mW | Idle | 2.0 ms | 1.2 ms | |
| PS 4 | 5 mW | Idle | 0.5 ms | 9.5 ms | |
When a drive and the host OS both support the Autonomous Power State Transition (APST) feature in NMVe 1.1 or later, the host system can give the drive a set of rules for how long it should wait while idle before dropping down to a lower-power state. Operating systems choose these delays based on the power state entry and exit latencies claimed by the drive, and other configuration information about the system's overall tolerance for increased disk access times.
One common problem with the NVMe APST feature is that the NVMe spec doesn't really say anything about how APST interacts with PCIe Active State Power Management. SSD vendors tend to make assumptions that eg. a system which configures the drive to use its deepest idle state will fully support PCIe APSM. Most of the time, things work out, but it's also possible to end up with a drive that goes to sleep and never wakes up, or a drive that defaults back to its highest power state if anything goes wrong when it tries to go to sleep.
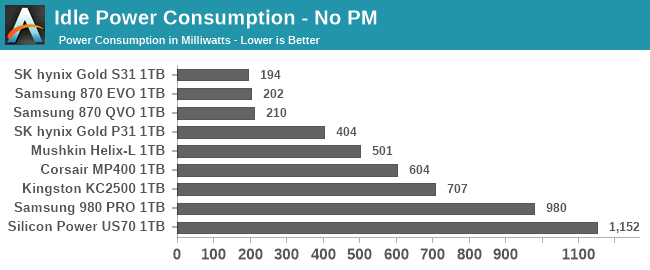
Using our Coffee Lake testbed that has fully functional PCIe power management, we test SSD power in three states. Active idle is when the drive is not using any externally-configurable power management features: SATA or PCIe link power management is disabled, and NVMe APST is off. We're now using a more reliable and broadly-compatible method for disabling APST through the Linux kernel rather than directly poking the drive's registers. This means that some drives will probably end up showing higher active idle power draw than we have previously measured.
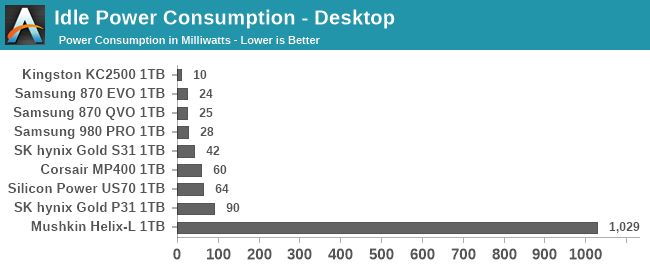
Even though there are many combinations of power management settings and power states that can be used with a typical consumer NVMe SSD, we condense it down to just two low-power configurations to test. What we call "Desktop Idle" is using the features that are almost always available and working on desktop platforms, even if they're off by default. This includes enabling SATA ALPM, NVMe APST, and PCIe ASPM.
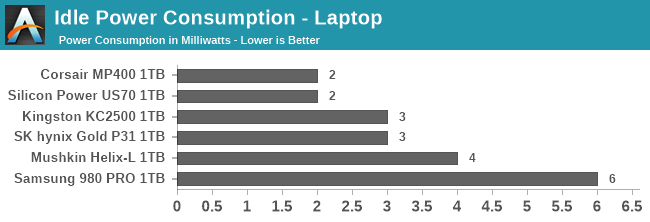
Next, we have the "Laptop Idle" state, with all the power-saving features fully enabled. For SATA SSDs, this would include DevSleep, so we can't fairly measure the Laptop Idle power draw of SSDs. For NVMe SSDs, this includes enabling PCIe L1 substates.
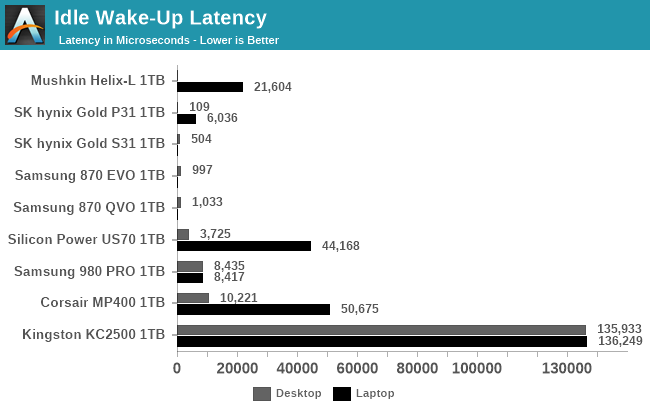
Accurately measuring the time it takes for a drive to enter a low-power state is tricky, but measuring the time taken to wake up is straightforward. We run a synthetic test that performs a single 4kB random read once every 10 seconds. When power management features are disabled and the drive stays in its active idle state, the random read latency will be determined mainly by the speed of the NAND flash. When the drive is in the Desktop Idle or Laptop Idle state, it will go to sleep between each random read, so we can repeatedly sample the time taken to wake up and perform a random read. The difference between this time and the random read latency from the drive in the active idle state is due almost entirely to the overhead of waking up the drive from a sleep state, and this difference is what we report as a drive's wake-up latency.
Conclusions
In this article we hope we've given you an insight into how much goes into testing a modern solid state storage drive - something more than just running CrystalDiskMark and finding peak sequential speeds! The new suite is not only more in-depth, but also we've streamlined it somewhat for automation, enabling fewer sleepless nights as deadlines loom on the horizon (or put another way, more reviews to come). We're obviously keen to take on additional feedback with the testing, so please leave a comment below.
from Hacker News https://ift.tt/2Ms4LEG
No comments:
Post a Comment
Note: Only a member of this blog may post a comment.