pyCirclize: Circular visualization in Python
![]()
Table of contents
Overview
pyCirclize is a circular visualization python package implemented based on matplotlib. This package is developed for the purpose of easily and beautifully plotting circular figure such as Circos Plot and Chord Diagram in Python. In addition, useful genome and phylogenetic tree visualization methods for the bioinformatics field are also implemented. pyCirclize was inspired by circlize and pyCircos. More detailed documentation is available here.
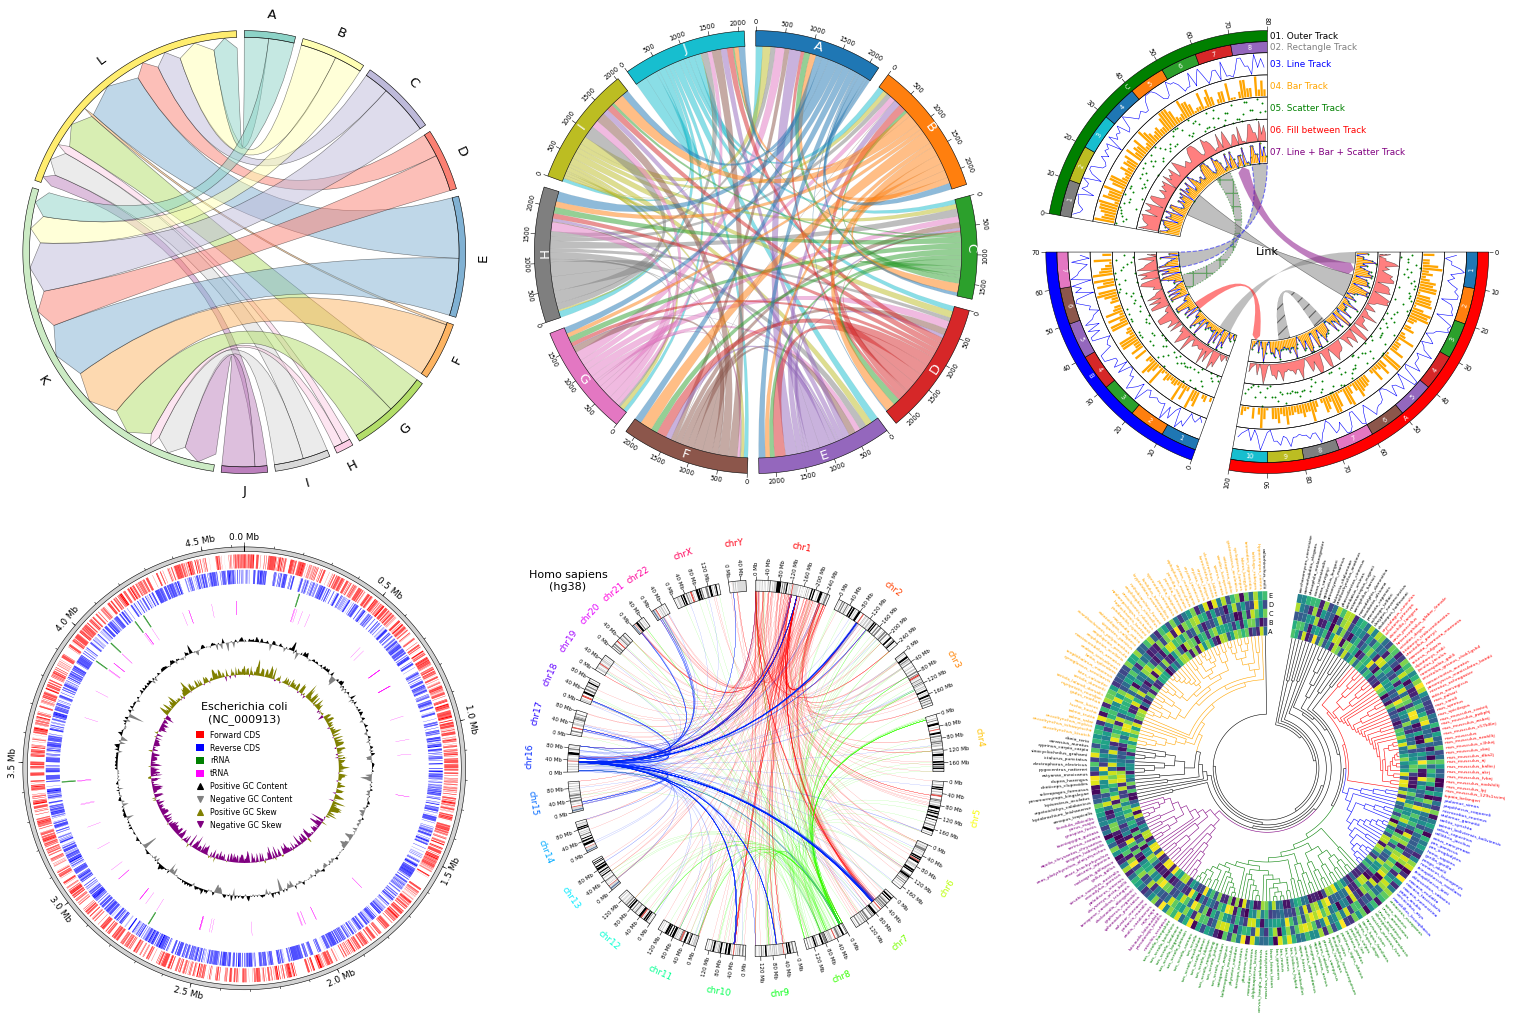
Fig.1 pyCirclize example plot gallery
Installation
Python 3.8 or later is required for installation.
Install PyPI package:
Install conda-forge package:
conda install -c conda-forge pycirclize
API Usage
API usage is described in each of the following sections in the document.
Not Implemented Features
List of features implemented in other Circos plotting tools but not yet implemented in pyCirclize. I may implement them when I feel like it.
- Plot histogram
- Plot boxplot
- Plot violin
- Plot raster image
- Label position auto adjustment
from Hacker News https://ift.tt/rqzIpyS
No comments:
Post a Comment
Note: Only a member of this blog may post a comment.