New arXiv working paper on the new color palette functions palette.colors() and hcl.colors() in base R since version 4.0.0.
Citation
Achim Zeileis, Paul Murrell (2023). “Coloring in R’s Blind Spot.” arXiv.org E-Print Archive arXiv:2303.04918 [stat.CO]. doi:10.48550/arXiv.2303.04918
Abstract
Prior to version 4.0.0 R had a poor default color palette (using highly saturated red, green, blue, etc.) and provided very few alternative palettes, most of which also had poor perceptual properties (like the infamous rainbow palette). Starting with version 4.0.0 R gained a new and much improved default palette and, in addition, a selection of more than 100 well-established palettes are now available via the functions palette.colors() and hcl.colors(). The former provides a range of popular qualitative palettes for categorical data while the latter closely approximates many popular sequential and diverging palettes by systematically varying the perceptual hue, chroma, luminance (HCL) properties in the palette. This paper provides an overview of these new color functions and the palettes they provide along with advice about which palettes are appropriate for specific tasks, especially with regard to making them accessible to viewers with color vision deficiencies.
Software
Package grDevices in base R provides palette.colors() and hcl.colors() and accompanying functionality since version R 4.0.0.
Package colorspace (CRAN, Web page) provides color vision deficiency emulation along with many other color tools. See also below for the recent bug fix in color vision deficiency emulation.
Replication code: coloring.R, paletteGrid.R
Highlights
The table below provides an overview of the new base R palette functionality: For each main type of palette, the Purpose row describes what sort of data the type of palette is appropriate for, the Generate row gives the functions that can be used to generate palettes of that type, the List row names the functions that can be used to list available palettes, and the Robust row identifies two or three good default palettes of that type.
| Qualitative | Sequential | Diverging | |
|---|---|---|---|
| Purpose | Categorical data | Ordered or numeric data (high → low) |
Ordered or numeric with central value (high ← neutral → low) |
| Generate | palette.colors(),hcl.colors() |
hcl.colors() |
hcl.colors() |
| List | palette.pals(),hcl.pals("qualitative") |
hcl.pals("sequential") |
hcl.pals("diverging"),hcl.pals("divergingx") |
| Robust | "Okabe-Ito", "R4" |
"Blues 3", "YlGnBu", "Viridis" |
"Purple-Green","Blue-Red 3" |
Based on this, the color defaults in base R were adapted. In particular, the old default palette was replaced by the "R4" palette, using very similar hues but avoiding the garish colors with extreme variations in brightness (see below for an example).
Recently, the recommended package lattice also changed its default color theme (in version 0.21-8), using the qualitative "Okabe-Ito" palette as the symbol and fill color and the sequential "YlGnBu" palette for shading regions.
Qualitative palettes in palette.colors
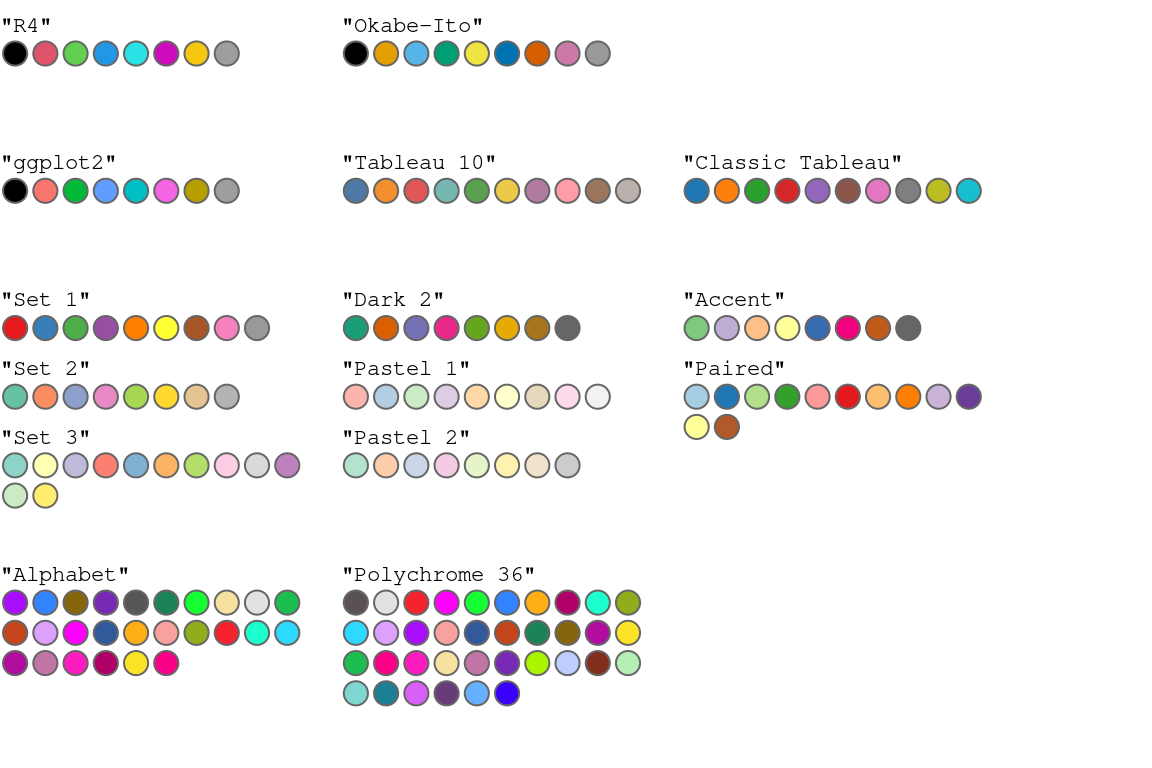
All palettes provides by the palette.colors() functions are shown below (except the old default "R3" palette which is only implemented for backward compatibility).
Lighter palettes are typically more useful for shading areas, e.g., in bar plots or similar displays. Darker and more colorful palettes are usually better for coloring points or line. The palettes "R4" and "Okabe-Ito" are particularly noteworthy because they have been designed to be reasonably robust under color vision deficiencies.
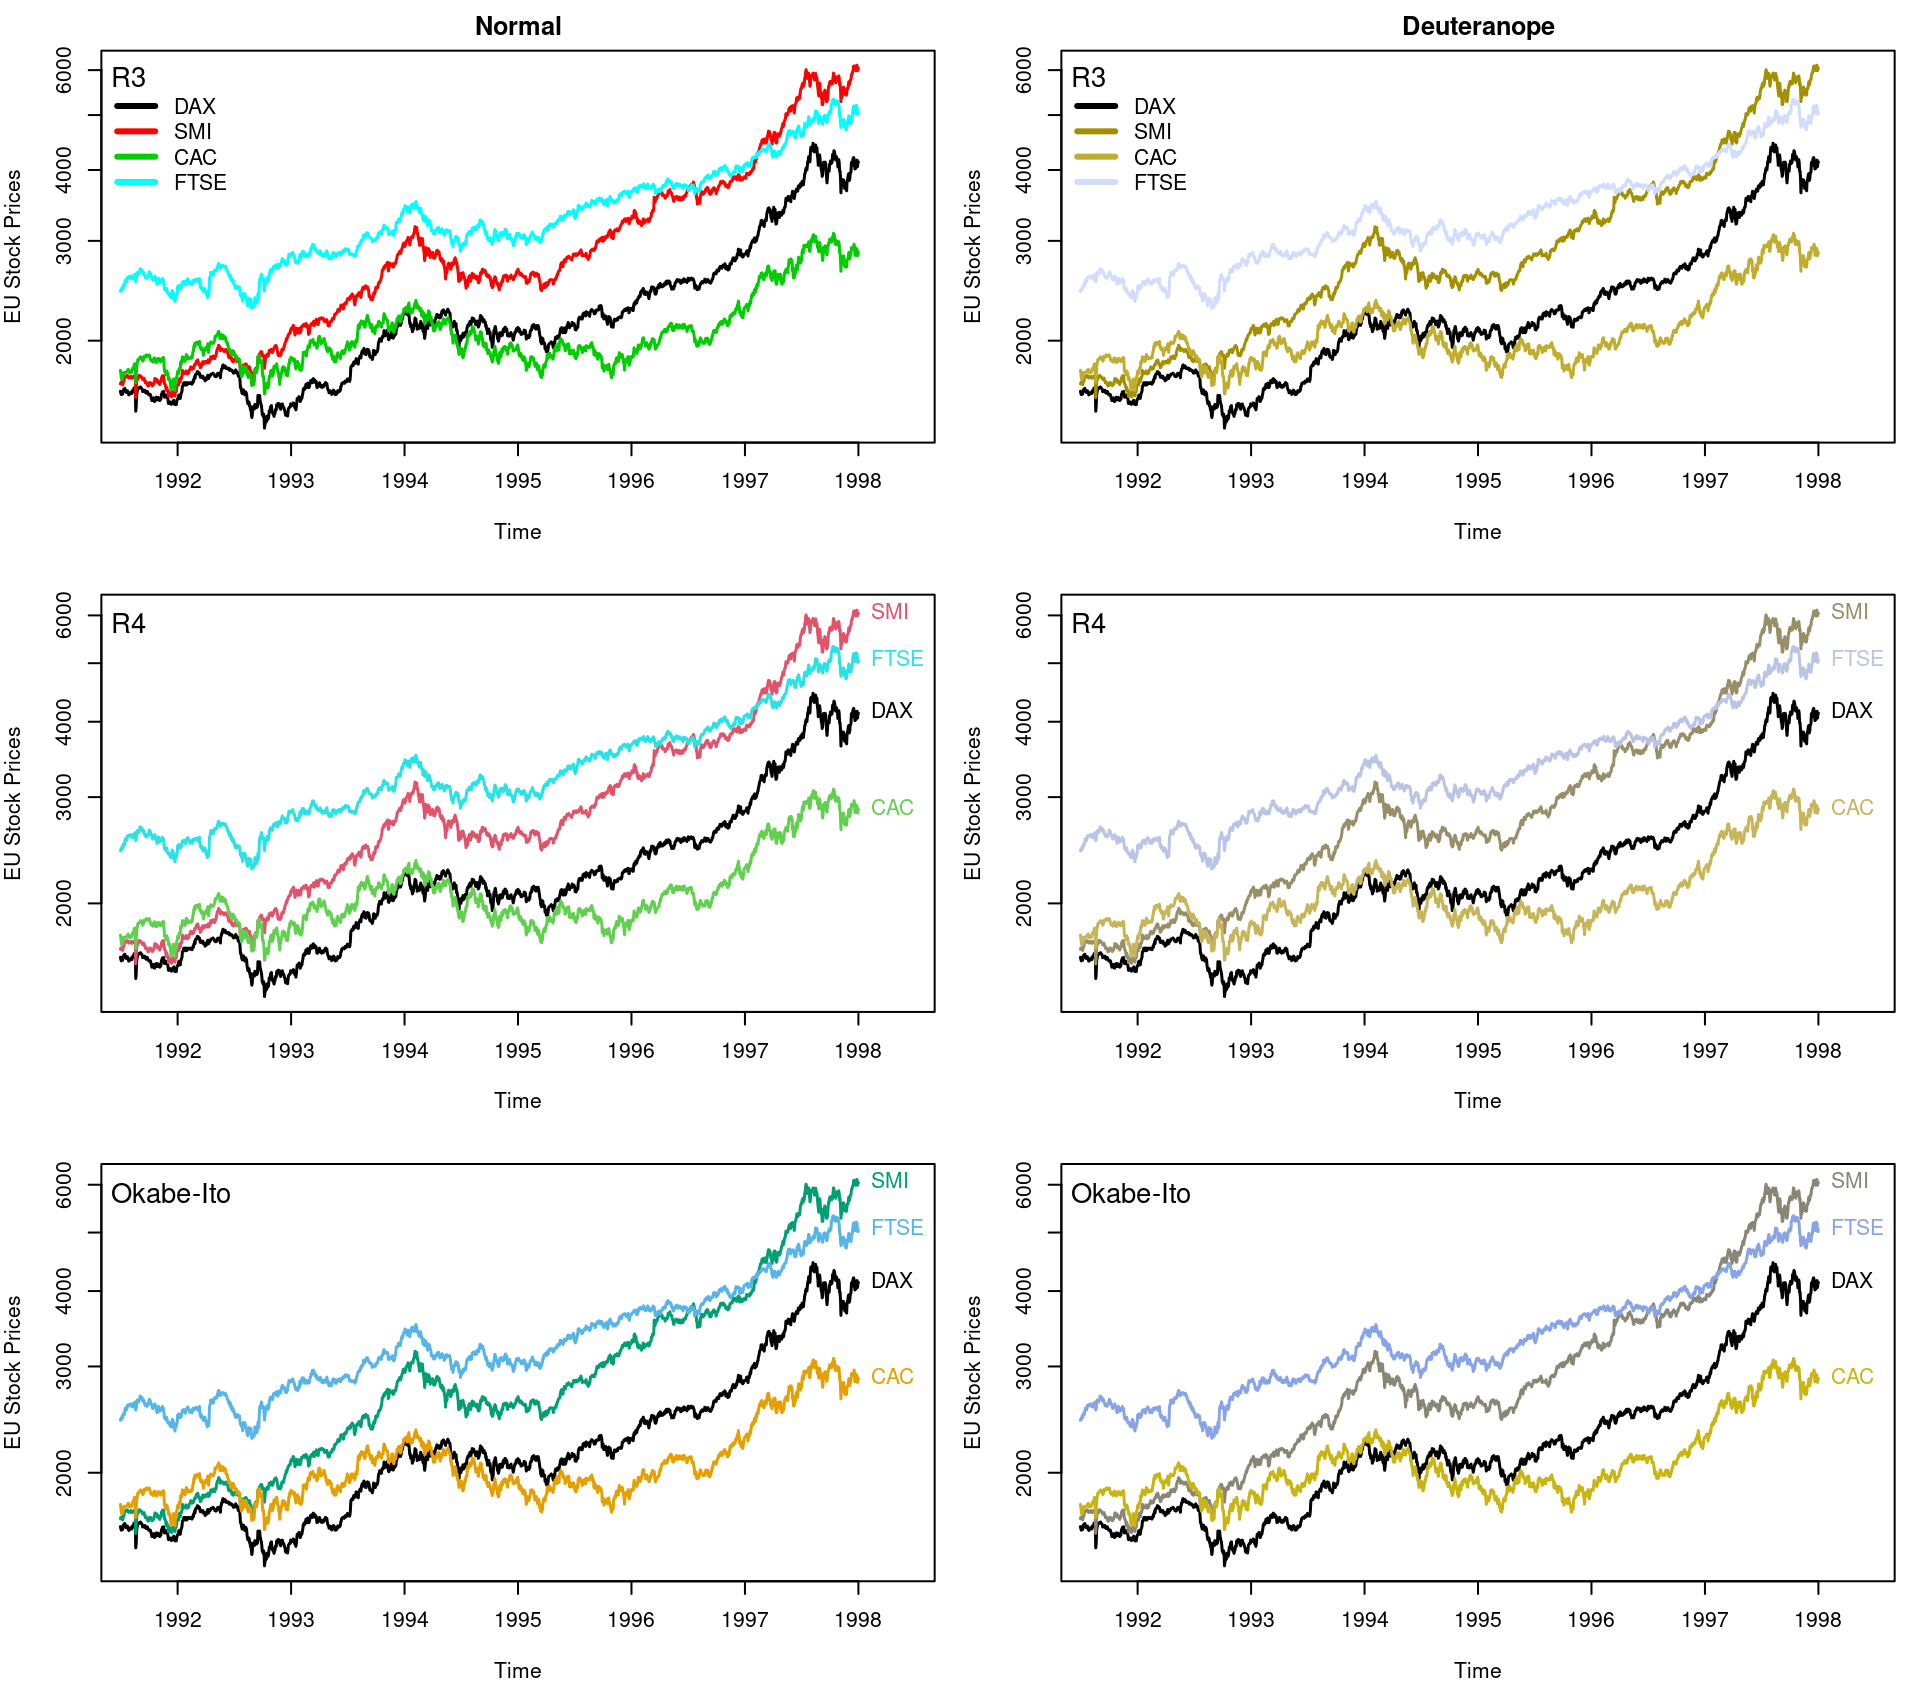
This is illustrated in a time series line plot of the base R EuStockMarkets data. The three rows show different palette.colors() palettes: The old "R3" default palette (top), the new "R4" default palette (middle), and the "Okabe-Ito" palette (bottom). The columns contrast normal vision (left) and emulated deuteranope vision (right), the most common type of color vision deficiency. A color legend is used in the first row and direct labels in the other rows.
We can see that the "R3" colors are highly saturated and they vary in luminance (brightness). For example, the cyan line is noticeably lighter than the others. Futhermore, for deuteranope viewers, the CAC and the SMI lines are difficult to distinguish from each other (exacerbated by the use of a color legend that makes matching the lines to labels almost impossible). Moreover, the FTSE line is more difficult to distinguish from the white background, compared to the other lines. The "R4" palette is an improvement: the luminance is more even and the colors are less saturated, plus the colors are more distinguishable for deuteranope viewers (aided by the use of direct color labels instead of a legend). The "Okabe-Ito" palette works even better, particularly for deuteranope viewers.
Sequential and diverging palettes in hcl.colors
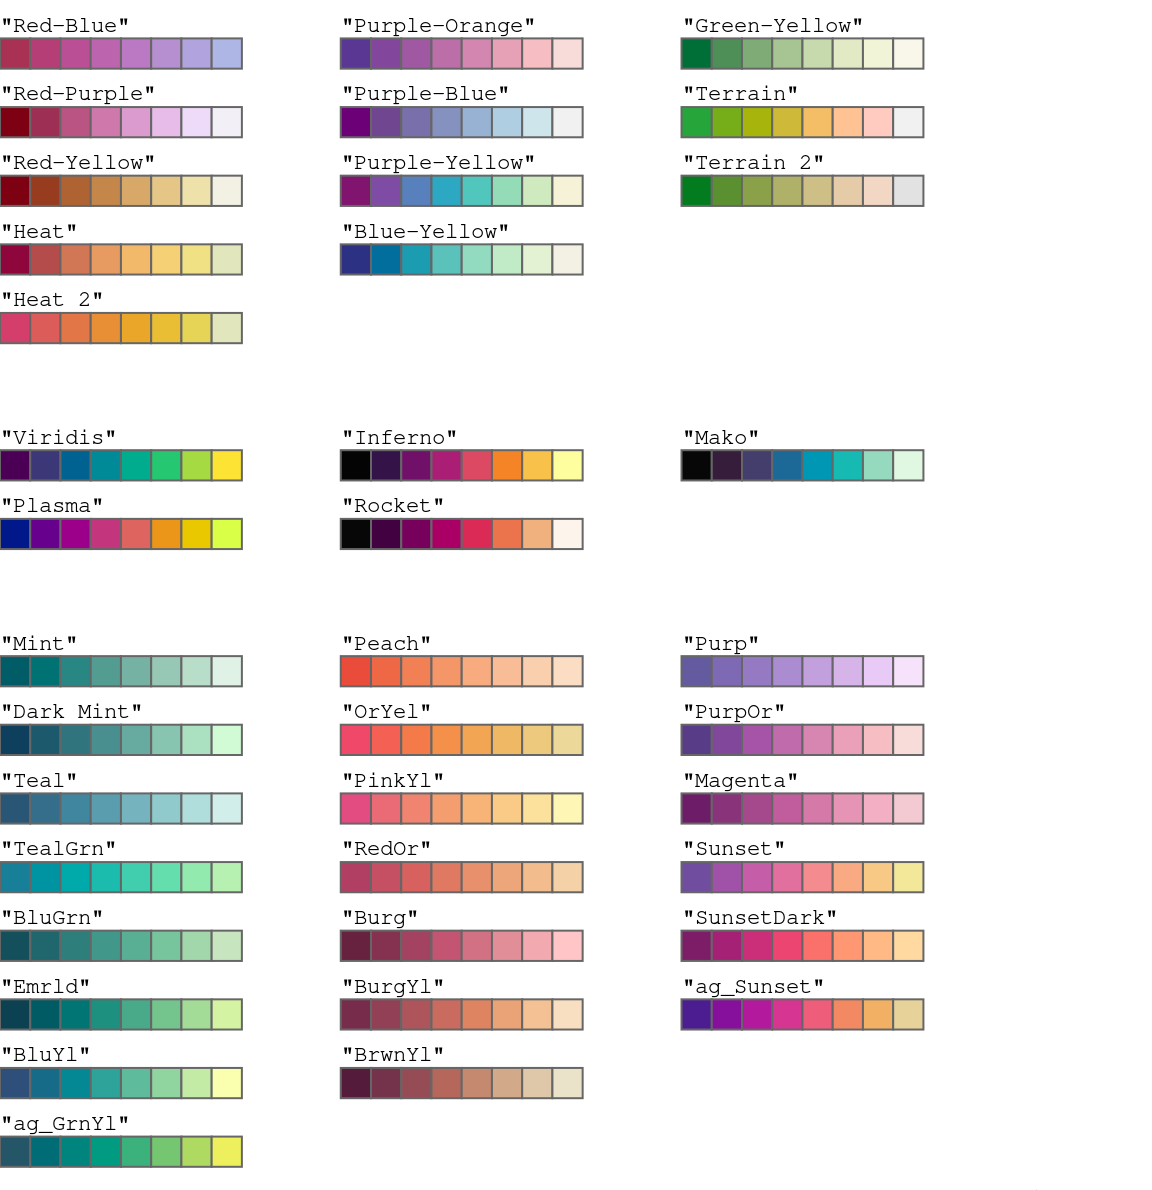
In addition to qualitative palettes, the hcl.colors() function provides a wide range of sequential and diverging palettes designed for numeric or ordered data with or without a neutral reference value, respectively. There are more than 100 such palettes, many of which closely approximate palettes from well-established packages such as the ColorBrewer.org, the Viridis family, CARTO colors, or Crameri’s scientific colors. The graphic below depicts just a subset of the multi-hue sequential palettes for illustration.
Some empirical examples and more insights are provided in the working paper linked above.
from Hacker News https://ift.tt/gBsqTpo


No comments:
Post a Comment
Note: Only a member of this blog may post a comment.