Since the summer of 2020 the United States has been experiencing a deadly wave of violence, and New York City has not been immune. The number of homicides in the city shot up 47% in 2020, and rose another 4% last year. While the tally is down 9% so far this year there have been some shocking murders, not to mention a mass shooting on the subway that miraculously didn’t take any lives.
Regular consumers of the news would thus be forgiven for believing that the Big Apple has become a terribly dangerous place. And yes, it is markedly more dangerous than it was before the pandemic. I’m not here to dismiss concerns about rising crime in the city. But a little context is in order. And by “a little context,” I mean a lot of charts.
The historical context, which a fair number of people are aware of, is that New York’s pandemic murder wave followed a long decline, with the city’s homicide rate in 2021 still less than a fifth what it was in 1990. The geographical context, which seems to be less widely understood, is that while homicide rates fell sharply all over the the US in the 1990s, that decline slowed in the 2000s and reversed starting in 2015. In Philadelphia the homicide rate is now worse than it was in the early 1990s, and in Chicago it’s close. Which means there’s a growing gap between New York City and most of the rest of urban America.
Safest of the Six Largest U.S. Cities
Homicides per 100K population*
Sources: Federal Bureau of Investigation; local police departments; Data Commons Place Explorer; Census Bureau; author's calculations
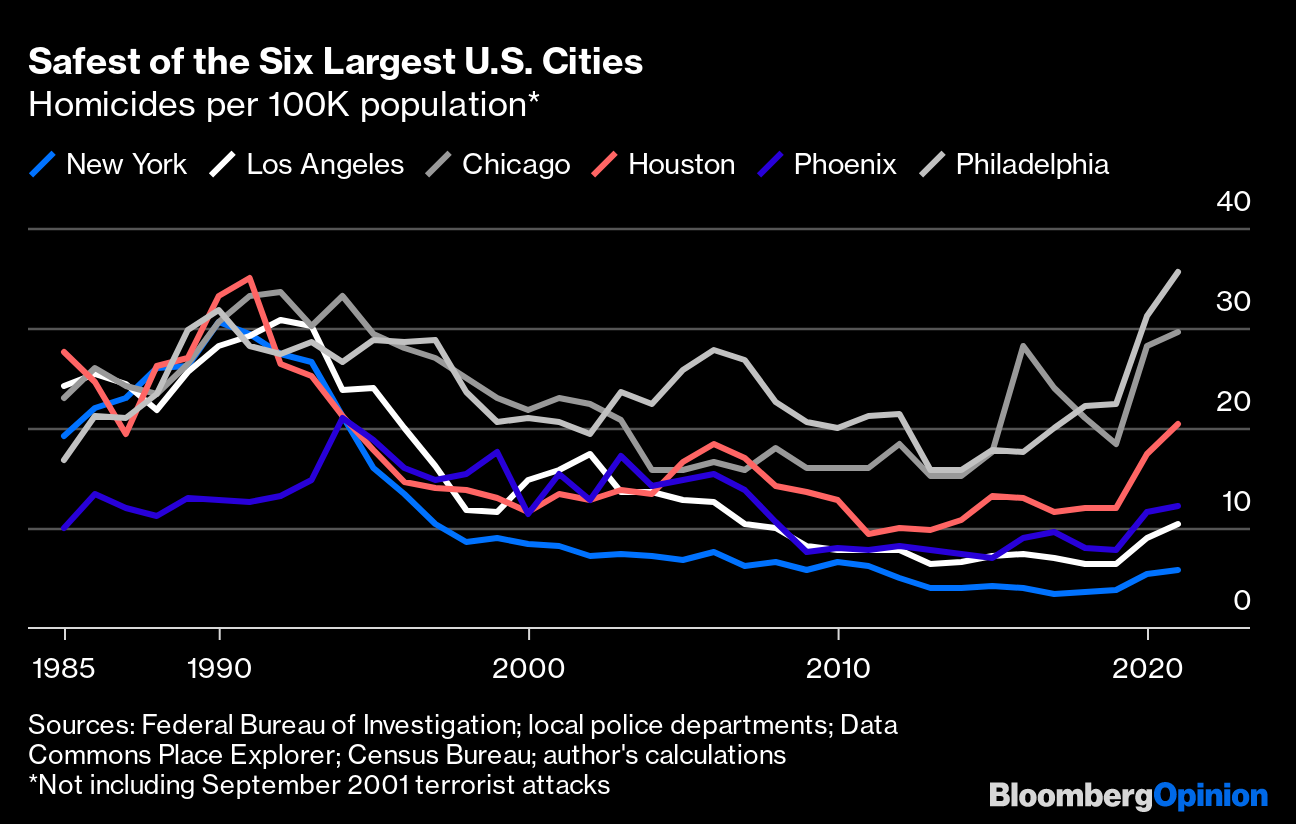
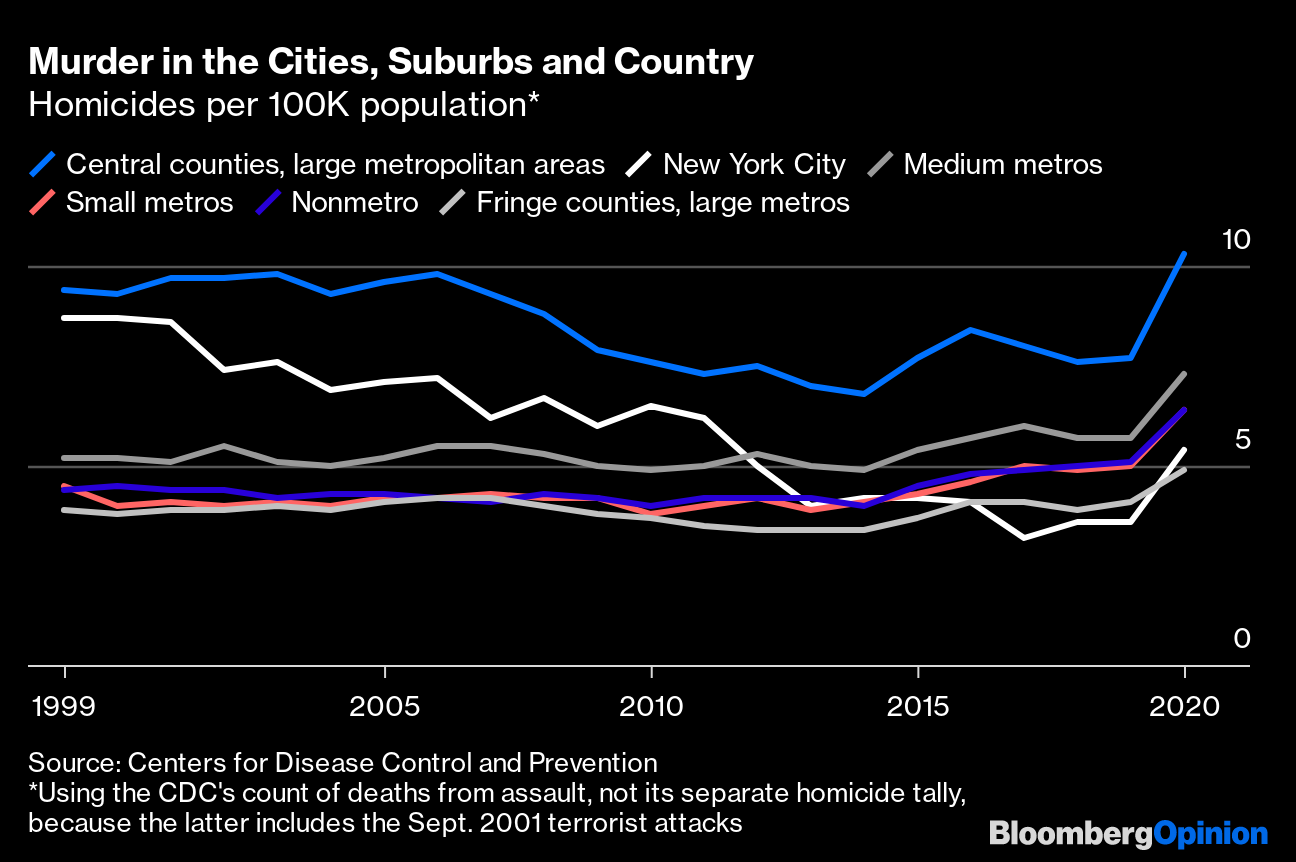
New York — which is where I happen to live — isn’t just safe relative to other big cities. The data in the above chart are from the Federal Bureau of Investigation and local police departments, but the Centers for Disease Control and Prevention also keep track of homicides as reported on death certificates, and one can sort them by, among other things, whether they befell residents of a county that contains all or part of the biggest city in a large (population of one million or more) metropolitan area, a fringe (suburban) county in such a metropolitan area, or elsewhere. Suburban counties in large metro areas have tended to have the lowest homicide rates, but New York City’s was even lower from 2017 to 2019 and was only slightly higher in 2020, the most recent year for which the CDC has full data.
Murder in the Cities, Suburbs and Country
Homicides per 100K population*
Source: Centers for Disease Control and Prevention
The CDC’s Wide-ranging Online Data for Epidemiologic Research, aka Wonder, databases, with which I have become way too familiar since the beginning of the pandemic, also contain statistics on every other cause of death listed in ICD-10, the 10th edition of the World Health Organization’s International Classification of Diseases.
Some causes of death other than homicide seem pretty relevant to assessing safety. Your risk of getting killed on the subway or in a subway station is much higher in New York City than in a place with no subway, for example, but if you add up all risks related to getting to work or school or wherever else it is you need to go, it’s a different story. New Yorkers are only about as third as likely to die in transportation accidents of any kind as Americans are overall. Put homicide and transportation risks together, and New York starts looking like a refuge from the American carnage.
Car Crashes Change the Picture
Homicide and transport accident deaths per 100K population
Source: Centers for Disease Control and Prevention
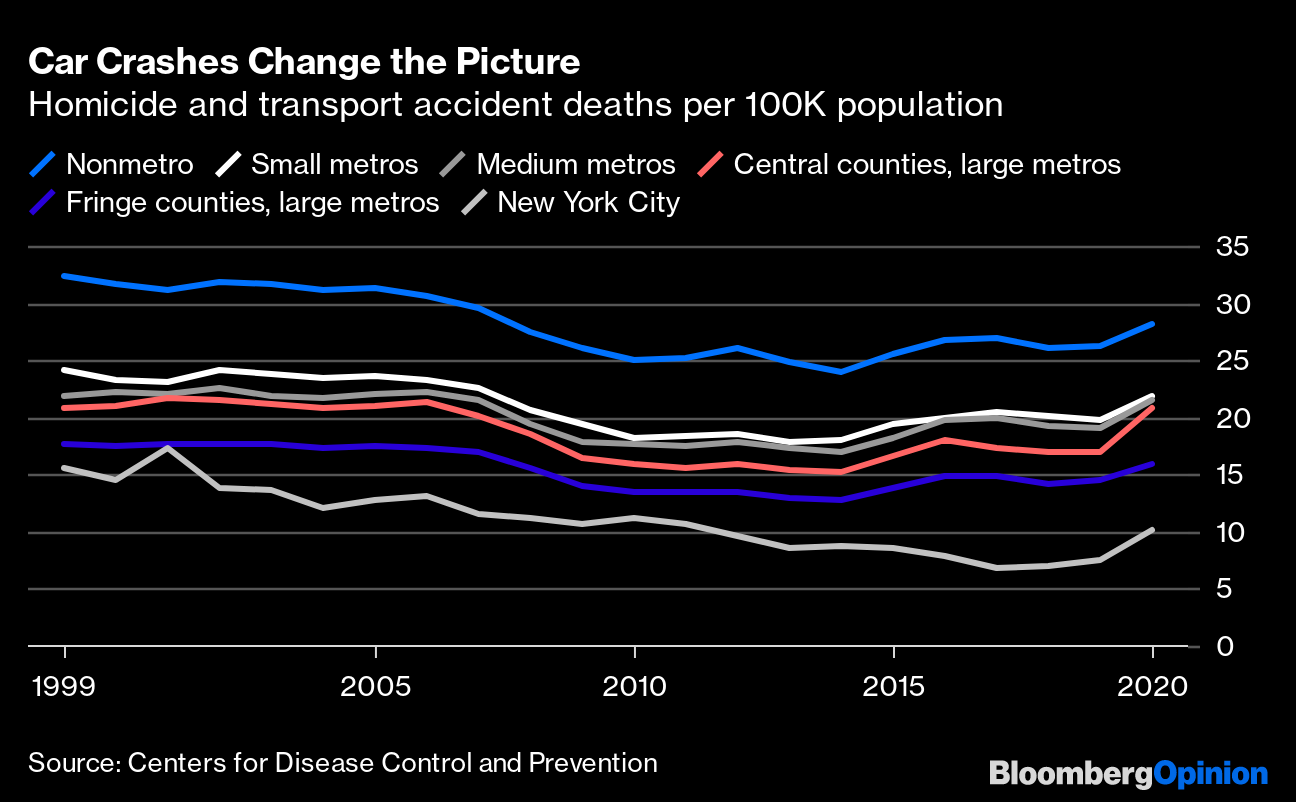
All these accountings leave out the September 2001 terrorist attacks. If included, those would push New York’s combined homicide and transport mortality rate for 2001 to 32. Remarkably, though, that’s still only slightly higher than the rate that year for rural and small town America — that is, in counties not part of metropolitan areas (which contained 86% of the US population in 2021). Rural life, in particular driving long distances on two-lane roads far from emergency services, can be a high-risk activity.
There are other accidental threats listed in ICD-10 that seem less salient in the city than in the country, and in some cases, the suburbs. To name a few: “contact with powered lawnmower,” “drowning and submersion while in swimming pool,” “contact with venomous snakes and lizards,” “victim of volcanic eruption.” So I ran the numbers again for mortality from all external causes.
Safer in the Big City
Deaths from external causes per 100K population
Source: Centers for Disease Control and Prevention
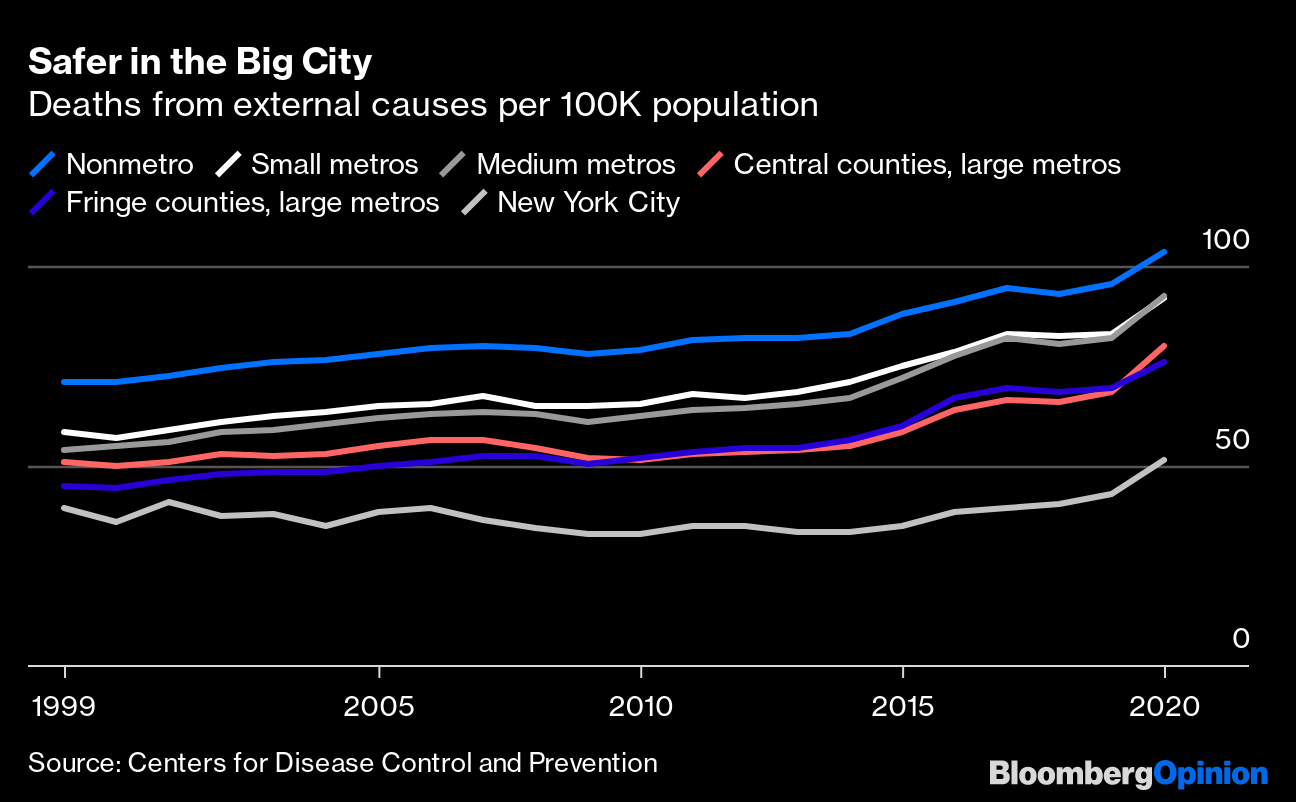
The mortality-rate gap between New York City and the rest of the country is even bigger in this chart than in the last one. But the trend has been headed in the wrong direction in New York and everywhere else for a while, mainly because of the opioid epidemic.
The explosion of drug-overdose deaths in the US over the past decade is one of the most depressing trends one encounters in CDC Wonder, but it does take us somewhat afield from what people usually have in mind when they consider whether a place is safe or dangerous. Same goes for suicides, which have also risen but not as sharply. Then there are external causes such as falls and surgical complications that are usually fatal only for the very old. If included in the calculations, they tend to make retirement communities look terribly dangerous, which doesn’t seem right.
Here’s what mortality from external causes looks like if one excludes (1) accidental poisoning (how drug overdoses are classified), (2) intentional self-harm, (3) falls, (4) complications of medical and surgical care and (5) sequelae of external causes of morbidity and mortality (after-effects, that is, which are also fatal mostly for the elderly).
Still Safer in the Big City
Deaths from selected external causes* per 100K population
Source: Centers for Disease Control and Prevention
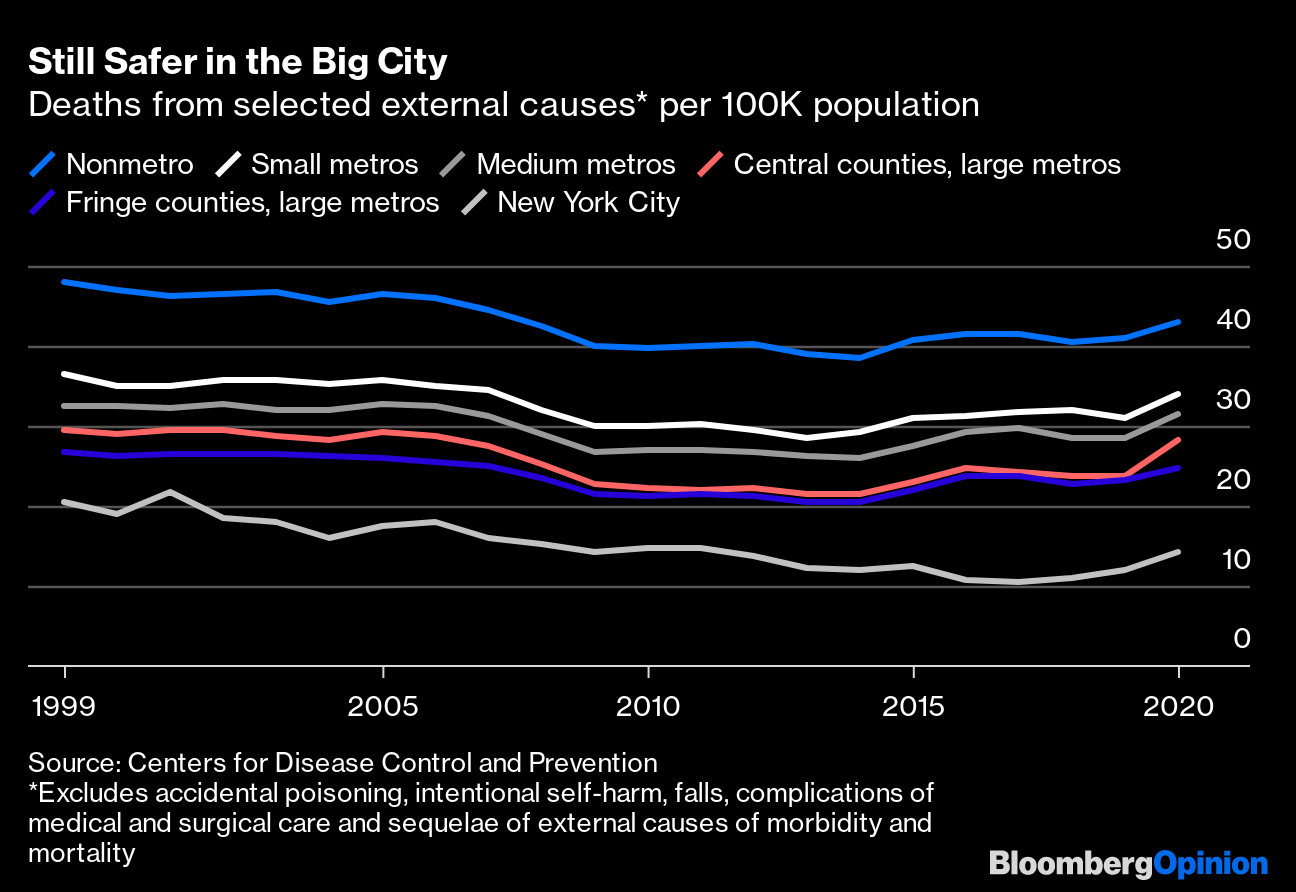
The overall lesson seems to be that the more urban your surroundings, the less danger you face. High homicide rates in some cities mean that the central counties in large metropolitan areas are on the whole slightly more dangerous than the suburban counties, but that’s the only exception. The risk of death from truly external causes, as defined here, is three times higher in rural and small-town America than in the country’s largest city.
This is so opposite from conventional wisdom that it’s worth teasing out why. One obvious explanation is that murder scares people a lot more than accidents do, and homicide risk is in fact highest in urban counties — just not in New York City. Another is that, as a colleague put it to me, you may be less likely to be victim of a crime in New York City, but you’re more likely to witness one. In dense urban environments you simply see a lot more of what’s going on, for good and ill. It’s also possible that the issue is not so much urban versus rural as it is who lives where. An affluent rural or exurban county where lots of people can work from home might be lower risk than a poorer urban one where most can’t. Rural counties in Appalachia or the Deep South might have very different profiles from those in New England or the Plains states.
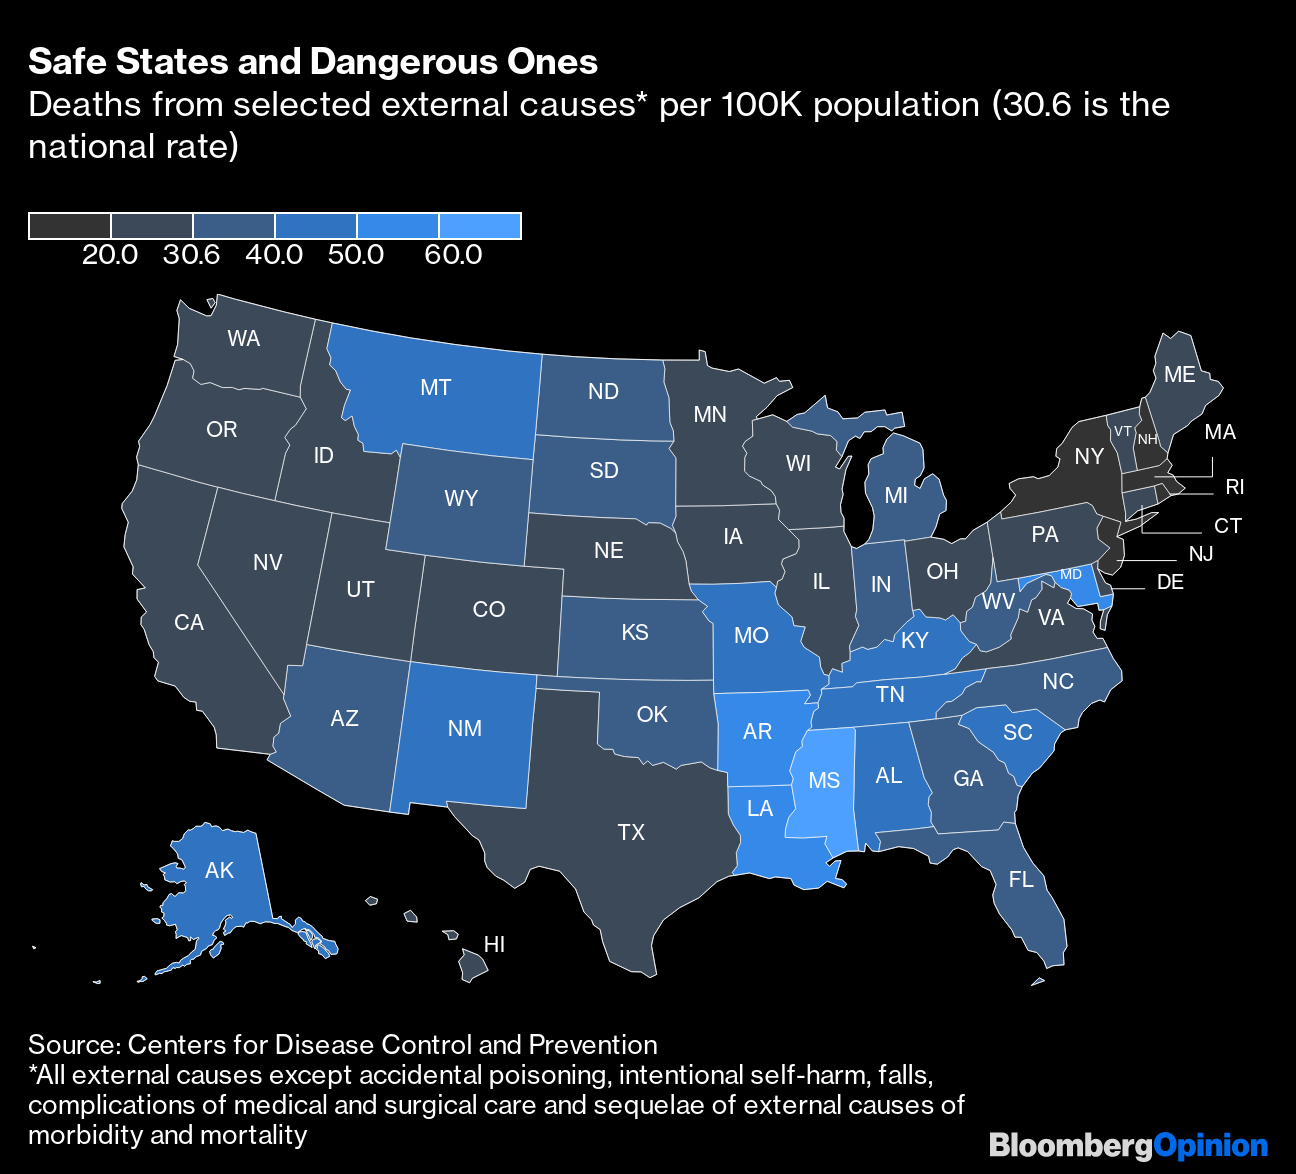
A look at 2020 selected-external-causes mortality by state offers some support for the latter interpretation. The Northeast is the safest part of the country, but some heavily rural states (Mississippi, Arkansas) are a lot more dangerous than others (Vermont, Iowa).
Safe States and Dangerous Ones
Deaths from selected external causes* per 100K population (30.6 is the national rate)
Source: Centers for Disease Control and Prevention
County-by-county statistics from the CDC provide added perspective, albeit with data limitations that I’ll get to in a moment.
The Safest Counties in America, Sort Of*
Deaths from selected external causes* per 100K population, 2020
Source: Centers for Disease Control and Prevention

The very safest places in America by this reckoning are very affluent suburbs. Loudoun County, Virginia, has the country’s highest median household income, at $147,111 according to the Census Bureau’s American Community Survey 2016-2020 estimates. All the other suburban counties here but Hampshire County, Massachusetts (which is less a suburb than an assortment of college towns), have median incomes above $100,000. Still, there are also three New York City boroughs in the top 15, all with median incomes below $90,000 but above the national median of $64,994. Brooklyn and the Bronx, where incomes are below the national median, come in a respectable 48th and 127th place in the county mortality rankings. Living in the country’s biggest city does seem to have its advantages, even for the non-wealthy.
But let’s not forget those data limitations. While CDC Wonder knows everything about mortality in the US, for privacy reasons it only shares what it knows if there are 10 or more deaths to report, and because of reliability concerns it only calculates mortality rates if there are 20 or more deaths. For the collection of external causes I selected, Wonder churned out 2020 death totals for 1,711 of the nation’s 3,143 counties and county equivalents (parishes in Louisiana, census areas in Alaska, independent cities in Virginia and some other states) and mortality rates for 997. It provided enough data to calculate the mortality rates for all 1,711, but I chose not to for the charts here. If I had, three more Northern Virginia cities and counties would have entered the top 10 along with Story County, Iowa, and La Crosse County, Wisconsin.
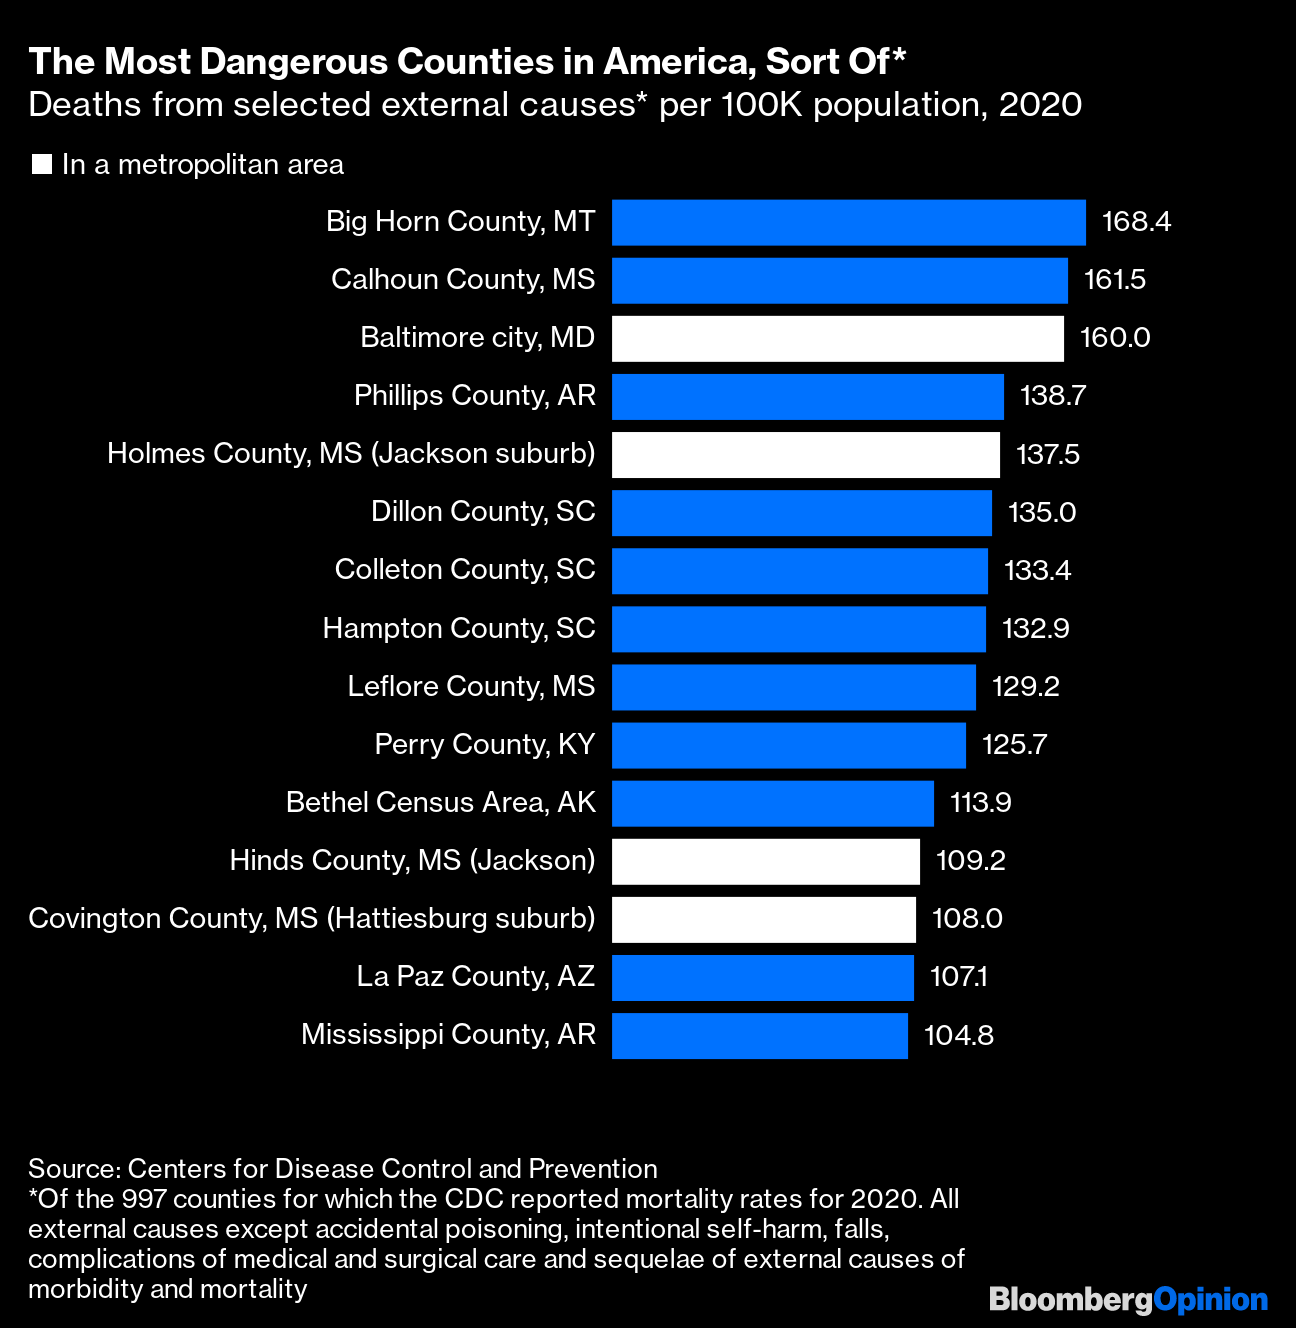
If I selected a wider array of external causes, or combined data from several years, more counties with smaller populations would enter the mix. Still, pretty much any version of the most-dangerous-counties list would be at least as heavy on rural counties as this.
The Most Dangerous Counties in America, Sort Of*
Deaths from selected external causes* per 100K population, 2020
Source: Centers for Disease Control and Prevention
There are a couple of other data issues worth mentioning. One is that all the mortality statistics except those in the very first chart are reported by the residence of the victims, not where the accident or homicide occurred. The CDC does offer some data on deaths by place of occurrence, but not with wildly different results, at least not for New York City, where 462 residents died of homicide in 2020 and 469 homicides occurred. If one were to use the latter number, there’s the question of what population to use in calculating mortality rates. New York City welcomes hundreds of thousands of commuters and tourists every day. Should they be counted in its population totals?
Also, because complete 2020 Census results have yet to be released, the CDC is still using outdated 2020 population estimates based on the 2010 census. For New York City, this estimate is 550,977 lower than the number from the 2020 census, and the CDC estimates for most of the 2010s are probably too low as well. To give a sense of the impact, the city’s CDC-calculated homicide rate of 5.4 per 100,000 in 2020 would drop to 5.1 using the census population. I decided to stick with the CDC’s numbers nonetheless because (1) the city likely lost several hundred thousand residents in the months following the April 1 census record date, and (2) redoing all the 2020 mortality-rate calculations using census data would have introduced a lot of opportunities for error. But keep in mind that all the mortality rates for New York City in recent years in the CDC-derived charts are probably slight overestimates.
Finally, it would be nice to see this data by metropolitan area, wouldn’t it? CDC Wonder’s most up-to-date deaths databases does not provide statistics by metro area. It is possible to download them by counties, then sort those into metropolitan areas, but with 2020 deaths data from my list of external causes available for only a little over half of US counties, that doesn’t really work. By combining deaths from the five most recent available years I was able to get a more complete county list, and fill in the blanks with a little extra effort. Here, then, are the safest metropolitan areas in the US from 2016 through 2020, by my admittedly somewhat idiosyncratic definition.
America’s Safest Metro Areas
Deaths from selected external causes* per 100K population, 2016-2020
Source: Centers for Disease Control and Prevention
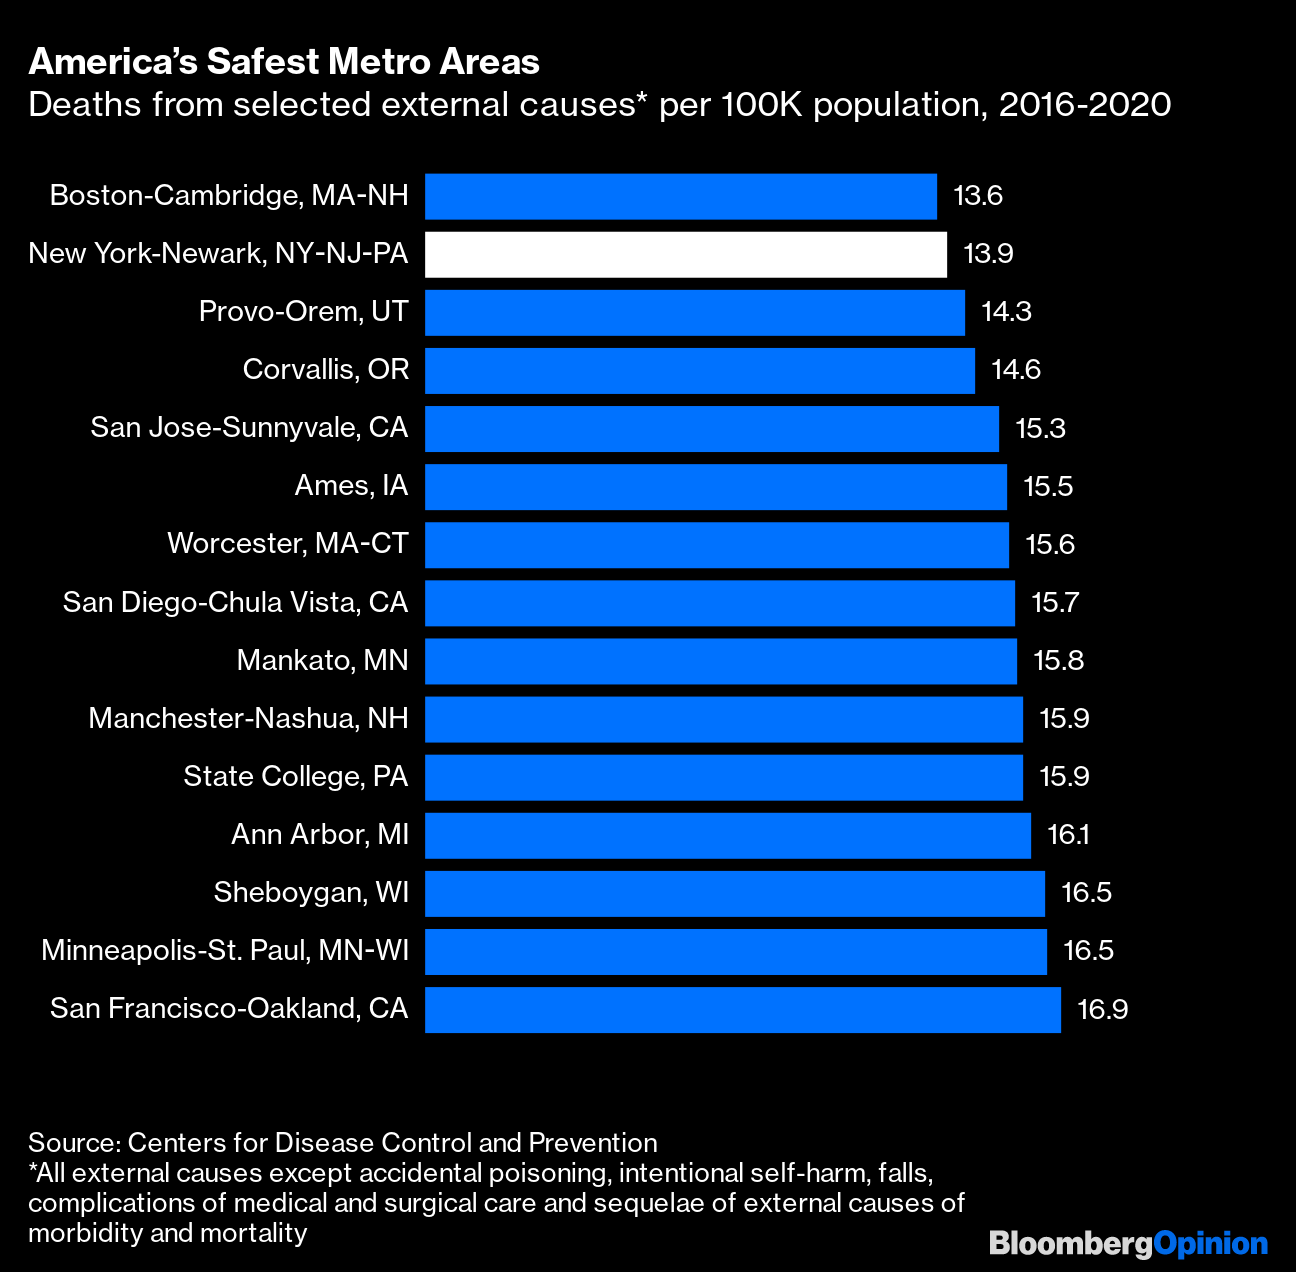
It’s a mix of affluent coastal metropolises (the Worcester and Nashua metro areas are both part of Greater Boston), college towns, the Twin Cities and … the “Malibu of the Midwest” (Sheboygan). All nice places!
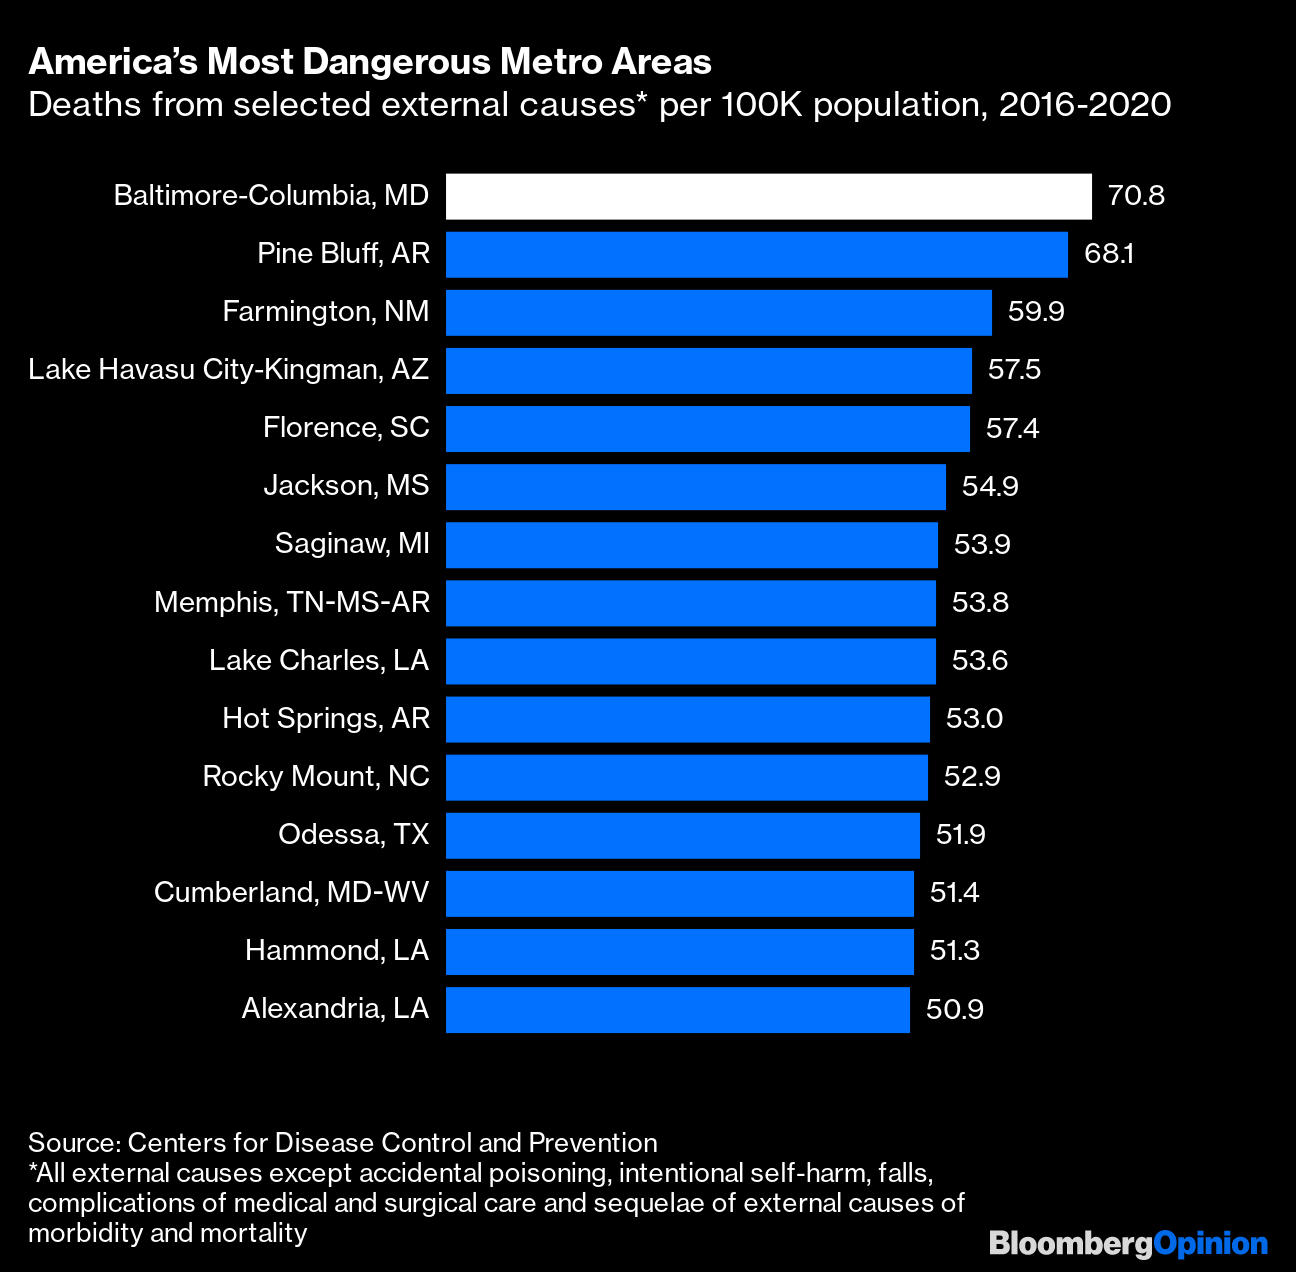
The most dangerous areas are a more hardscrabble lot, although led by an affluent coastal metro (Baltimore-Columbia) where the main city has an awful violent crime problem. The city of Baltimore’s homicide rate was a staggering 58.5 per 100,000 residents in 2021, twice that of Chicago and more than 10 times New York City’s.
America’s Most Dangerous Metro Areas
Deaths from selected external causes* per 100K population, 2016-2020
Source: Centers for Disease Control and Prevention
Even the safest areas in the US remain killing fields compared with most of Western Europe. In Paris, the city described in 2016 by presidential candidate Donald Trump as “so, so, so out of control, so dangerous,” the homicide rate in recent years has been well below one death per 100,000 residents, and traffic deaths below three per 100,000, meaning that Parisians face a combined risk from those two sources about one-third that of New Yorkers. So there’s lots of room for improvement in New York City. There’s just even more room for improvement almost everywhere else in the US.
Data sources for charts
Safest of the Six Largest U.S. Cities: The main data sources here are the FBI’s Crime Data Explorer and Census Bureau annual population estimates that I got from the Data Commons Place Explorer (for pre-2010 numbers) and the Census Bureau (for 2010-2021). I could not find city population estimates for 1985-1989 so I calculated my own by just assuming the cities grew (or shrank) at a uniform pace between the 1980 and 1990 censuses. The FBI hasn’t released 2021 crime data yet so I got that year’s numbers either directly from police departments or from news reports based on police department data. Also, for some reason the FBI’s post-2014 homicide numbers for Philadelphia are different from (and lower than) those on the Philadelphia Police Department website, so I went with the latter.
Murder in the Cities, Suburbs and Country: This is downloaded straight from CDC Wonder’s Underlying Causes of Death database, but there are two different ways to get homicide totals from that. One is to look under “Injury Intent and Mechanism” and select “homicide” as the injury intent, the other is to look through the ICD-10 codes used to classify all causes of death and select “assault” under “External causes of morbidity and mortality.” The former includes deaths from terrorist attacks and the latter does not, because they are classified under a separate ICD-10 category of “Codes for special purposes.” When this piece was first published, the chart showed homicide deaths with the September 2001 terrorist attacks subtracted out (for consistency with the FBI data and because otherwise New York’s high 2001 rate would make the chart very hard to read); subsequently I realized it would be simpler and more consistent with the other charts to use the assault numbers, which are almost but not quite identical. Here they are by county urbanization status (I combined the two categories of nonmetro counties for the charts) and for New York City. Once you click through, you’ll have to agree to a couple of data use restrictions, then wait as CDC Wonder generates the data.
Car Crashes Change the Picture: This adds together assault plus transportation accident deaths as reported under “External causes of morbidity and mortality.” Here they are by county urbanization, and for New York City.
Safer in the Big City: This is all “External causes of morbidity and mortality,” by county urbanization, and for New York City.
Still Safer in the Big City: This is external causes minus the categories discussed in the text and the chart footnotes, by county urbanization and for New York City.
Safe States and Dangerous Ones: Selected external causes by state for 2020.
The Safest Counties in America, Sort Of, and The Most Dangerous Counties in America, Sort Of: Selected external causes by county for 2020.
America’s Safest Metro Areas and America’s Most Dangerous Metro Areas: Selected external causes by county for 2016-2020, which I then sorted into metro areas using the Census Bureau’s March 2020 core-based statistical area delineation file. Twenty metro areas had at least one county for which CDC Wonder suppressed the deaths data because there were fewer than 10, so I went in and selected all the counties in each of the 20 to get combined mortality totals for each.
More From Bloomberg Opinion:
Want more Bloomberg Opinion? Terminal readers head to OPIN <GO>. Web readers click here.
(This column was corrected to point out that all the data referenced in the seventh paragraph leave out deaths from the September 2001 terrorist attacks.)
This column does not necessarily reflect the opinion of the editorial board or Bloomberg LP and its owners.
To contact the author of this story:
Justin Fox at justinfox@bloomberg.net
To contact the editor responsible for this story:
Susan Warren at susanwarren@bloomberg.net
from Hacker News https://ift.tt/OuoMfgP
No comments:
Post a Comment
Note: Only a member of this blog may post a comment.