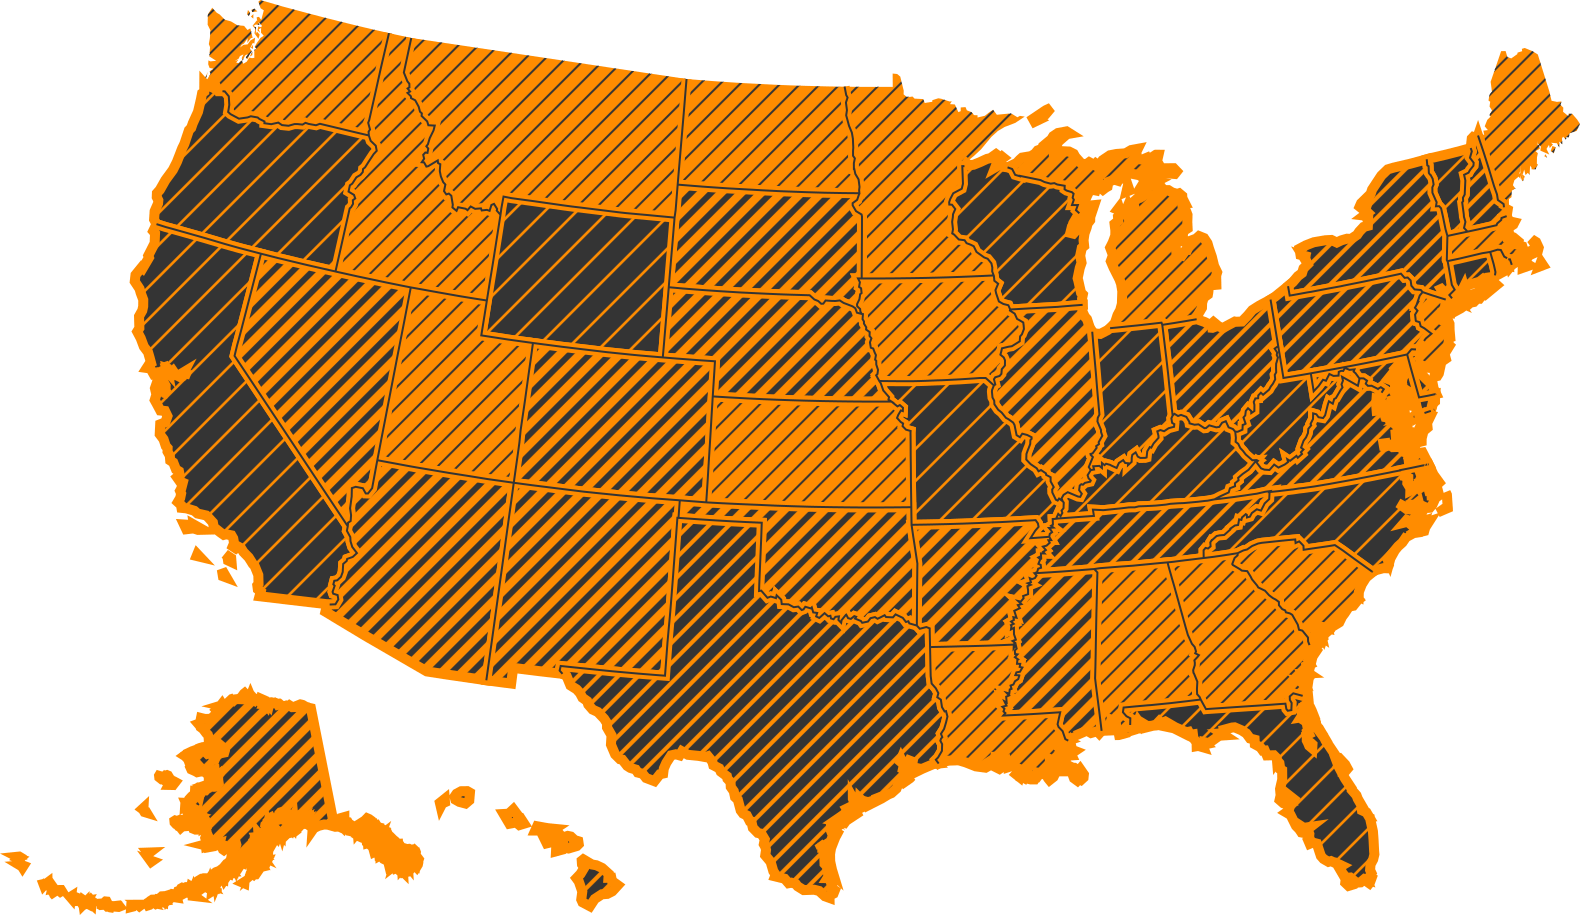
Textures.js
SVG patterns for Data Visualization
Textures are useful for the
selective perception of different categories
Getting started
-- from the top of d3.js --
var svg = d3.select("#example")
  .append("svg");

var t = textures.lines()
  .thicker();

svg.call(t);

svg.append("circle")
        .style("fill", t.url());
Lines
textures.lines();textures.lines()
.heavier();textures.lines()
.lighter();textures.lines()
.thicker();textures.lines()
.thinner();textures.lines()
.heavier(10)
.thinner(1.5);textures.lines()
.size(4)
.strokeWidth(1);textures.lines()
.size(8)
.strokeWidth(2);textures.lines()
.orientation("vertical")
.strokeWidth(1)
.shapeRendering("crispEdges");textures.lines()
.orientation("3/8")
.stroke("darkorange");textures.lines()
.orientation("3/8", "7/8")
.stroke("darkorange");textures.lines()
.orientation("vertical", "horizontal")
.size(4)
.strokeWidth(1)
.shapeRendering("crispEdges")
.stroke("darkorange");textures.lines()
.orientation("diagonal")
.size(40)
.strokeWidth(26)
.stroke("darkorange")
.background("firebrick");Colors and textures can be combined
to have further levels of selection
Circles
textures.circles();textures.circles()
.heavier();textures.circles()
.lighter();textures.circles()
.thicker();textures.circles()
.thinner();textures.circles()
.complement();textures.circles()
.size(5);textures.circles()
.radius(4);textures.circles()
.radius(4)
.fill("transparent")
.strokeWidth(2);textures.circles()
.radius(4)
.fill("darkorange")
.strokeWidth(2)
.stroke("firebrick")
.complement();textures.circles()
.size(10)
.radius(2)
.fill("firebrick")
.background("darkorange");Textures of increasing size can represent an order relation

Paths
textures.paths()
  .d("hexagons")
  .size(8)
  .strokeWidth(2)
  .stroke("darkorange");
textures.paths()
.d("crosses")
.lighter()
.thicker();textures.paths()
.d("caps")
.lighter()
.thicker()
.stroke("darkorange");textures.paths()
.d("woven")
.lighter()
.thicker();textures.paths()
.d("waves")
.thicker()
.stroke("firebrick");textures.paths()
.d("nylon")
.lighter()
.shapeRendering("crispEdges");textures.paths()
.d("squares")
.stroke("darkorange");Create custom patterns
var t = textures.paths()
  .d(s =>
    `M 0,${s * 3 / 4}
    l ${s / 2},${-s / 2}
    l ${s / 2},${s / 2}`
  )
  .size(20)
  .strokeWidth(1)
  .thicker(2)
  .stroke("darkorange");
from Hacker News https://ift.tt/2YF6kT1
No comments:
Post a Comment
Note: Only a member of this blog may post a comment.