Weimin Liu
1, Ronnie M. Russell
1, Frederic Bibollet-Ruche
1, Ashwin N. Skelly
1, Scott Sherrill-Mix
1, Drew A. Freeman
1, Regina Stoltz, Emily Lindemuth, Fang-Hua Lee, Sarah Sterrett, Katharine J. Bar, Nathaniel Erdmann, Sigrid Gouma, Scott E. Hensley, Thomas Ketas, Albert Cupo, Victor M. Cruz Portillo, John P. Moore, Paul D. Bieniasz, Theodora Hatziioannou, Greer Massey, Mary-Beth Minyard
2, Michael S. Saag, Randall S. Davis, George M. Shaw, William J. Britt, Sixto M. Leal, Paul Goepfert, and Beatrice H. Hahn
Coronavirus disease (COVID-19) is typically diagnosed by reverse transcription PCR (RT-PCR) amplification of severe acute respiratory syndrome coronavirus 2 (SARS-CoV-2) RNA from nasopharyngeal fluids (1). RT-PCR yields cycle threshold (Ct) values that are inversely correlated with viral loads (2) and thus provide an estimate of the number of SARS-CoV-2 RNA copies in the sample. Serologic assays complement COVID-19 diagnosis by documenting past infections. In most persons, binding and neutralizing antibodies develop within 1–3 weeks after onset of symptoms (3), and titers correlate with disease severity (4).
Initial serosurveys identified antibodies in nearly 100% of persons with RT-PCR–confirmed SARS-CoV-2 infection (5). However, more recent studies have shown that seroconversion rates are surprisingly variable (6–10). For example, a multicenter study from Israel reported that 5% of participants remained seronegative despite a positive test result on a nasal swab specimen (6). In contrast, a seroprevalence study from New York found that 20% of persons with a positive RT-PCR test result did not seroconvert (8). Another study from Germany reported that 85% of confirmed infected COVID-19 contacts failed to develop antibodies (9). To examine the reasons for these differences, we investigated the relationship between seroconversion and demographic, clinical, and laboratory data in a convenience sample of convalescent persons recruited at the University of Alabama at Birmingham (Birmingham, Alabama, USA) in 2020.
We studied 72 persons, all of whom had a previous positive RT-PCR test but were symptom-free for >3 weeks before blood was collected for testing (Table). Only 2 persons (3%) reported no symptoms, whereas 13 (18%) persons reported mild disease, 48 (67%) reported moderate disease, and 9 (12%) reported severe disease (Appendix Table 1).
We tested plasma samples (n = 144) collected at enrollment and follow-up visits for antibodies to the spike protein by using a validated ELISA (Appendix). Only 46 of the 72 participants had detectable IgG responses, IgA responses, or both (Table); reciprocal endpoint titers ranged from 182 to >312,500 (Appendix Table 2). Analysis of the same samples for receptor-binding domain (RBD) and nucleocapsid (N) antibodies yielded very similar results (Appendix Figure 1). All persons with spike protein antibodies also had detectable RBD (IgG, IgM, or both) or N (IgG) protein responses, except for 1 participant whose spike protein endpoint titers were very low (Appendix Table 2). In contrast, 26 participants remained seronegative, despite the testing of up to 3 samples per person for IgA, IgM, and IgG against multiple antigens as well as neutralizing antibodies. Thus, 36% of our cohort represented serologic nonresponders.
Figure 1
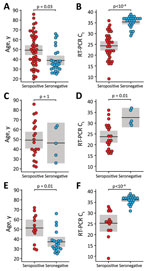
Figure 1. Relationship of age and nasopharyngeal viral loads with SARS-CoV-2 serostatus among convalescent persons after SARS-CoV-2 infection. Participants were a convenience sample of convalescent SARS-CoV-2–infected persons recruited at the University of...
Figure 2
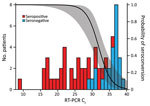
Figure 2. Decreasing probability of SARS-CoV-2 seroconversion with increasing RT-PCR Ctvalues among persons recovered from SARS-CoV-2 infection. Participants were a convenience sample of convalescent SARS-CoV-2–infected persons recruited at the University...
To investigate potential reasons for the lack of seroconversion, we examined available demographic, clinical, and laboratory data. Comparing race/ethnicity, sex, and symptom severity, we failed to find a significant association with serostatus (Table), although we did observe a trend for increasing antibody positivity with increasing symptom severity (Appendix Figure 2). We also found no significant differences in seroconversion between patients reporting or not reporting various symptoms, including symptoms characteristic of COVID-19 (Appendix Figure 3). However, seronegative persons were on average 10 (95% CI 3–17) years younger than seropositive persons (Figure 1, panel A) and exhibited RT-PCR Ct values that were 11 (95% CI 8–14) cycles higher (Figure 1, panel B). Moreover, logistic regression showed a precipitous decline in the probability of seroconversion at higher Ct values (Figure 2). For example, a Ct of 35 predicted only a 15% (95% CI 5%–37%) probability of seroconversion, which decreased further with increasing Ct values. Thus, low nasopharyngeal viral loads seem insufficient to elicit a systemic antibody response.
For control, we plotted Ct values of serologic responders and nonresponders against the times of RT-PCR and antibody testing relative to symptom onset (Appendix Figure 4). In both cases, the distributions of sampling times were similar for the 2 groups, thus excluding the possibility that seronegative persons had higher Ct values because they were tested too late or that they lacked antibodies because they were tested too early. We also examined remnants of purified RNA used for the initial diagnosis for the presence of SARS-CoV-2 sequences. By analyzing 12 available samples (Appendix Table 1), we were able to amplify full-length intact spike genes from 4 specimens, including 2 from seronegative persons with high Ct values (Appendix Figure 5).
Finally, we asked whether the relationship between seroconversion, age and Ct values was dependent on the diagnostic laboratory. We found that 2 sites with highly sensitive RT-PCR tests (University of Alabama at Birmingham Fungal Reference Laboratory and Children’s of Alabama Diagnostic Virology Laboratory in Birmingham) were 6 (95% CI 2–30) times more likely to identify serologic nonresponders than a third site with a less sensitive test (Assurance Scientific Laboratories in Birmingham) (Appendix Methods). However, this difference did not change the relationship between Ct values and seroconversion because seronegative persons had higher Ct values than seropositive persons regardless of the test site (Figure 1, panels D, F). In contrast, we observed little association between age and seroconversion at the Assurance Scientific Laboratories site (Figure 1, panel C), and the difference observed at the other sites was largely driven by young persons who also had high Ct values (Figure 1, panel E). Thus, nasopharyngeal viral loads represent a major correlate of the systemic antibody response, whereas age seems to have only a minor effect.
In summary, we show that patients with low SARS-CoV-2 viral loads in their respiratory tract are less likely to mount a systemic antibody response. Although we cannot formally exclude false-positive RT-PCR results in some participants, PCR contamination is highly unlikely as an explanation for our findings (Appendix). We also show that clinical illness does not guarantee seroconversion and that laboratories with highly sensitive RT-PCR assays are more likely to detect serologic nonresponders. These results provide an explanation for the puzzling variability of seroconversion in different cohorts.
The fact that a considerable fraction of RT-PCR positive persons fail to seroconvert has practical implications. Such persons remain undetected in seroprevalence studies, including in vaccine studies that assess protection from asymptomatic infection by measuring antibodies to antigens not included in the vaccine. Seroconverters and nonseroconverters will probably also respond differently to vaccination. Recent studies revealed that seropositive persons have a heightened antibody response after the first, but not the second, dose of an mRNA vaccine, suggesting that a single dose is sufficient (11–13; Samanovic et al., unpub. data, https://doi.org/10.1101/2021.02.07.21251311). Serologic nonresponders might not exhibit a similarly heightened anamnestic response, but resemble SARS-CoV-2 naive persons, as was observed for 1 previously infected vaccinee who never seroconverted (14). Finally, RT-PCR positive persons who experienced COVID-19 symptoms might be less inclined to seek vaccination, believing they are protected, but our results caution against this assumption.
Dr. Liu is a virologist at the University of Pennsylvania. His primary research interests include the evolutionary history and biology of zoonotic pathogens.
from Hacker News https://ift.tt/3x85KfD
No comments:
Post a Comment
Note: Only a member of this blog may post a comment.