Adam McCann, Financial Writer
Jun 24, 2020
It’s been decades since the landmark decision in Brown v. Board of Education declared school segregation unconstitutional in 1954, though it took years for schools to actually adopt that ruling. Now, no one can be denied enrollment in a school due to the color of their skin, but that doesn’t necessarily mean that educational conditions are equal for all students. A recent study found that school districts that have a high concentration of white students receive $23 billion more per year in funding than those that have a high concentration of non-white students. Lower funding can lead to lower quality education, which can affect not only a person’s income trajectory but also their career trajectory for the rest of their life.
In order to determine which states have the most racial equality in education at a time when protests against racism and inequality are happening all across the U.S., WalletHub compared the 50 states across six key metrics. Our data compares the difference between white and black Americans in areas such as high school and college degrees, test scores and graduation rates. Read on for the results and a full description of our methodology.
Main Findings
State Education Systems with the Most Racial Equality
| Overall Rank* | State | Total Score |
|---|---|---|
| 1 | Wyoming | 75.03 |
| 2 | West Virginia | 74.91 |
| 3 | Montana | 74.76 |
| 4 | New Mexico | 71.61 |
| 5 | Idaho | 71.52 |
| 6 | New Hampshire | 64.61 |
| 7 | Vermont | 63.78 |
| 8 | Texas | 59.76 |
| 9 | Arizona | 59.36 |
| 10 | Oklahoma | 59.08 |
| 11 | Tennessee | 56.98 |
| 12 | Kentucky | 56.66 |
| 13 | Arkansas | 54.26 |
| 14 | North Dakota | 53.71 |
| 15 | Georgia | 51.84 |
| 16 | Hawaii | 51.79 |
| 17 | Delaware | 50.28 |
| 18 | Alabama | 49.93 |
| 19 | Oregon | 49.66 |
| 20 | Mississippi | 49.42 |
| 21 | Nevada | 48.96 |
| 22 | Maine | 47.55 |
| 23 | Indiana | 47.16 |
| 24 | Washington | 46.41 |
| 25 | Florida | 45.67 |
| 26 | North Carolina | 45.26 |
| 27 | Rhode Island | 45.23 |
| 28 | Missouri | 44.11 |
| 29 | California | 42.75 |
| 30 | Alaska | 42.22 |
| 31 | Louisiana | 41.35 |
| 32 | Utah | 41.30 |
| 33 | Maryland | 39.66 |
| 34 | Nebraska | 39.10 |
| 35 | Kansas | 37.02 |
| 36 | Michigan | 36.86 |
| 37 | Virginia | 36.56 |
| 38 | Colorado | 36.30 |
| 39 | Ohio | 35.41 |
| 40 | Iowa | 35.04 |
| 41 | New Jersey | 34.70 |
| 42 | South Carolina | 33.29 |
| 43 | Illinois | 33.06 |
| 44 | South Dakota | 31.14 |
| 45 | Massachusetts | 29.71 |
| 46 | New York | 28.48 |
| 47 | Pennsylvania | 28.29 |
| 48 | Connecticut | 23.88 |
| 49 | Minnesota | 21.58 |
| 50 | Wisconsin | 13.44 |
*No. 1 = Most Equality
Methodology
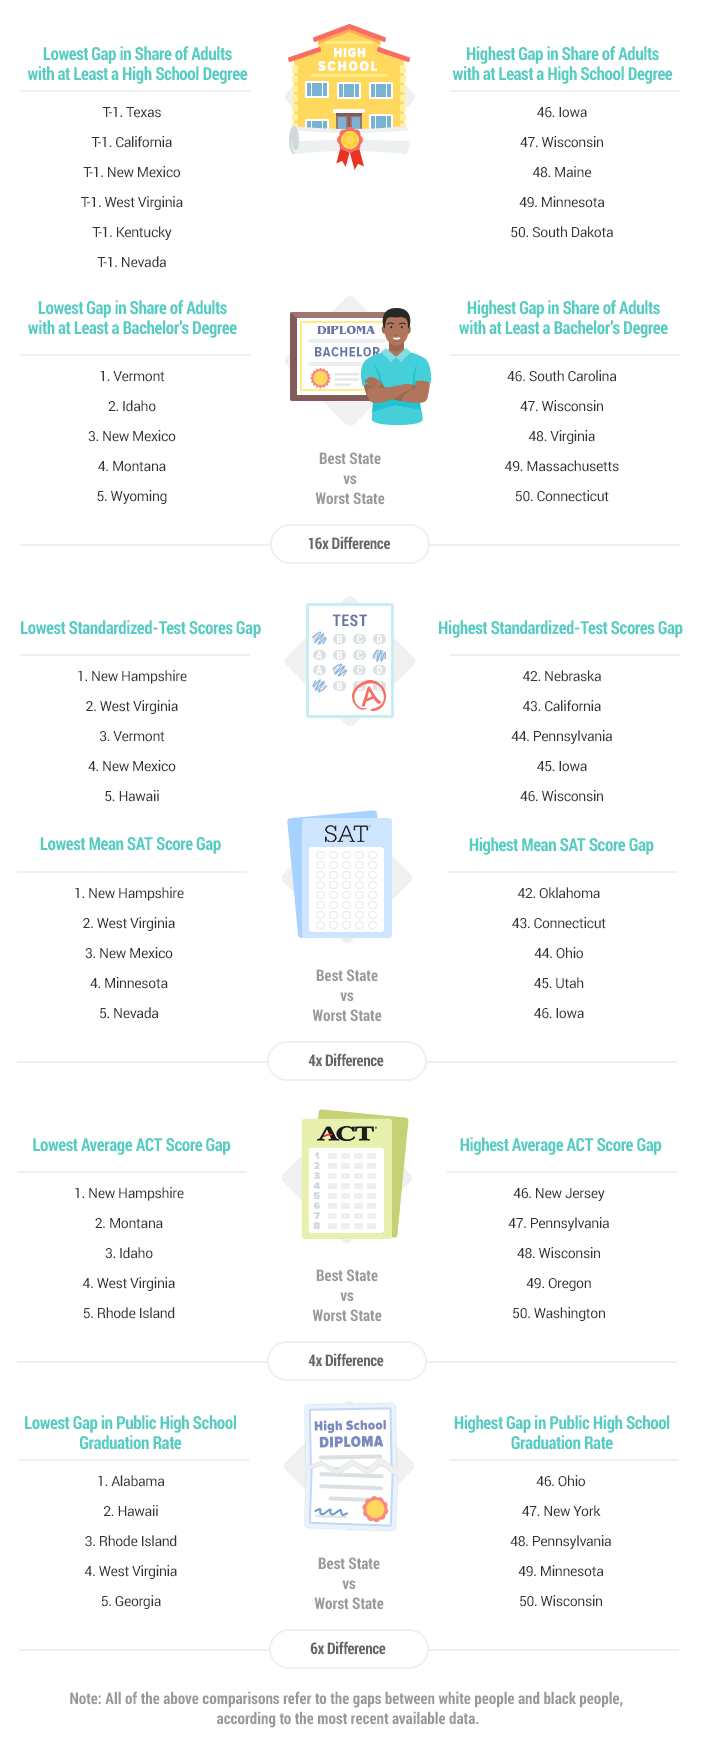
In order to determine the states with the most racial equality in education, WalletHub compared the 50 states across six relevant metrics, which are listed below with their corresponding weights. Each metric was graded on a 100-point scale, with a score of 100 representing the most equality. We determined the level of equality by subtracting the values attributed to white people and black people for a given metric, using only the most recent available data.
If in some states black people scored as high as or better than white people on a given metric, all such states were awarded the maximum number of points.
Finally, we determined each state’s weighted average across all metrics to calculate its total score and used the resulting scores to rank-order the states.
- Share of Adults with at Least a High School Degree: Half Weight (~9.09 Points)
Note: “Adults” include the population aged 25 and older. - Share of Adults with at Least a Bachelor’s Degree: Double Weight (~36.36 Points)
Note: “Adults” include the population aged 25 and older. - Standardized-Test Scores: Full Weight (~18.18 Points)
Note: This metric is based on the results of the National Assessment of Educational Progress (NAEP). - Mean SAT Score: Half Weight (~9.09 Points)
- Average ACT Score: Half Weight (~9.09 Points)
- Public High School Graduation Rate: Full Weight (~18.18 Points)
Sources: Data used to create this ranking were collected from U.S. Census Bureau, National Center for Education Statistics, ACT and College Board.
Video and Audio Files for News Use:
Was this article helpful?
Awesome! Thanks for your feedback.
Thank you for your feedback.
from Hacker News https://ift.tt/32cfetc
No comments:
Post a Comment
Note: Only a member of this blog may post a comment.