Wednesday, March 31, 2021

The Case for Trailer Parks

Few kinds of housing are more stigmatized than the mobile home. Just the name invokes squalor and destitution — one knows from the title alone that the show Trailer Park Boys is going to involve lower-class people living in grim conditions.

But there is nothing inherently bad about the humble trailer park. With some policy changes, they could be an important tool to increase efficiency and density in American cities, and provide millions of affordable homes to people who need them.

Now, it is definitely true that many trailer parks today are not ideal places to live. They have been heavily stigmatized in the media as the private version of public housing projects — supposedly full of disgusting poor people and criminals, and run by slumlords who skimp on maintenance. Most people with means therefore avoid them where possible, and most cities zone only small chunks of land for them, or ban them entirely. Often people buy the homes outright but rent the land in the park itself, leaving them exposed to rent increases because it costs thousands of dollars to move the home to a new location. This is a particular problem in parks that have been bought up by ruthless Wall Street bloodsuckers. The private equity firm Blackstone is notorious for buying up hundreds of parks and jacking the rent through the roof.

That said, mobile homes are still the largest source of affordable private housing in the country — home to about 20 million people. There are two main reasons: First, they are cheap to buy — because they are built in a factory with efficiencies of scale, prices run something like a third to half of what it would cost to build a similar house on-site. Second, they are packed closely together, usually about 5-9 homes per acre. That means cheap all-in costs — on the order of $1,000 or so per month for a new home, and in the mid-hundreds for a used one. Even today, many trailer parks are downright pleasant neighborhoods, with shared playgrounds, pools, and other amenities.

Practically all of the problems noted above are created by the business model of existing trailer parks. A manufactured home, if transported and installed correctly, is probably better-quality than the typical balloon-frame McMansion — and they could easily be made even better by retooling the factory. Mobile homes are made cheaply at present because they are aimed at the bottom of the housing market, but there's no reason they couldn't be made as high-quality as you like.

Parks don't need predatory landlords either. They could be subdivided into individual plots and owned individually, or set up as a co-op. Local cities could even buy and lease homes on a social housing model, or just rent out the land, at whatever it costs to cover expenses. Or tenants and owners could be protected with rent control rules.

Now, the usual detached single-family manufactured home is obviously not suitable for a built-up city like New York. But they are perfect in most of the rest of the country. Many American cities and suburbs have been struggling to deal with the inefficiencies of low-density suburban sprawl, which leads to higher infrastructure costs (as each piece of sewer pipe and power line services fewer people), and makes public transit and walkable business corridors difficult. Many very sprawly cities like Atlanta are also suffering from severe housing shortages and skyrocketing home prices, as the post-Great Recession collapse in home construction collides with a citizenry newly flush from the pandemic rescue packages.

Mobile homes are a great way to get more houses in place very quickly. A trailer park at 5 homes per acre and 2.5 people per household works out to 8,000 people per square mile, or more than twice as dense as Phoenix. Nine homes per acre works out to 14,400 people per square mile — denser than Boston — and that's by no means the upper bound. Throw in an apartment building or two on the corners and one could approach Philadelphia density, no problem. So simply reclaim one of the millions of huge underused surface parking lots that blight city centers across the country, and hey presto, you've got an ideal bus stop and enough customers for a thriving little commercial zone.

Moreover, there's no reason why apartment buildings couldn't also be manufactured with modular components that could be stacked up into many different shapes. Some companies already do this, though in the apartment space it is often goofy Silicon Valley startups that charge absurd markups.

But unlocking the potential of manufactured homes will require changes to land use regulations, and the general cultural mindset. In most cities trailer parks are illegal on most land, thanks to the stigma mentioned above, as well as density-reducing requirements for setbacks, large lot sizes, mandatory parking, and so on. Just change the rules, and millions of Americans could quickly discover that mobile homes are a lot better than they had been led to believe.


from Hacker News https://ift.tt/3cwqVQB

Never use environment variables for configuration

Suppose you need to create a function for adding two numbers together in plain C. How would you write it? What sort of an API would it have? One possible implementation would be this:

int add_numbers(int one, int two) {

    return one + two;

}


// to call it you'd do

int three = add_numbers(1, 2);

Seems reasonable? But what if it was implemented like this instead:

int first_argument;

int second_argument;


void add_numbers(void) {

    return first_argument + second_argument;

}


// to call it you'd do

first_argument = 1;

second_argument = 2;

int three = add_numbers();

This is, I trust you all agree, terrible. This approach is plain wrong, against all accepted coding practices and would get immediately rejected in any code review. It is left as an exercise to the reader to come up with ways in which this architecture is broken. You don't even need to look into thread safety to find correctness bugs.

And yet we have environment variables

Environment variables is exactly this: mutable global state. Envvars have some legitimate usages (such as enabling debug logging) but they should never, ever be used for configuring core functionality of programs. Sadly they are used for this purpose a lot and there are some people who think that this is a good thing. This causes no end of headaches due to weird corner, edge and even common cases.

Persistance of state

For example suppose you run a command line program that has some sort of a persistent state.

$ SOME_ENVVAR=... some_command <args>

Then some time after that you run it again:

$ some_command <args>

The environment is now different. What should the program do? Use the old configuration that had the env var set or the new one where it is not set? Error out? Try to silently merge the different options into one? Something else?

The answer is that you, the end user, can not now. Every program is free to do its own thing and most do. If you have ever spent ages wondering why the exact same commands work when run from one terminal but not the other, this is probably why.

Lack of higher order primitives

An environment variable can only contain a single null-terminated stream of bytes. This is very limiting. At the very least you'd want to have arrays, but it is not supported. Surely that is not a problem, you say, you can always do in-band signaling. For example the PATH environment variable has many directories which are separated by the : character. What could be simpler? Many things, it turns out.

First of all the separator for paths is not always :. On Windows it is ;. More generally every program is free to choose its own. A common choice is space:

CFLAGS='-Dfoo="bar" -Dbaz' <command>

Except what if you need to pass a space character as part of the argument? Depending on the actual program, shell and the phase of the moon, you might need to do this:

ARG='-Dfoo="bar bar" -Dbaz'

or this:

ARG='-Dfoo="bar\ bar" -Dbaz'

or even this:

ARG='-Dfoo="bar\\ bar" -Dbaz'

There is no way to know which one of these is the correct form. You have to try them all and see which one works. Sometimes, as an implementation detail, the string gets expanded multiple times so you get to quote quote characters. Insert your favourite picture of Xzibit here.

For comparison using JSON configuration files this entire class os problems would not exist. Every application would read the data in the same way, because JSON provides primitives to express these higher level constructs. In contrast every time an environment variable needs to carry more information than a single untyped string, the programmer gets to create a new ad hoc data marshaling scheme and if there's one thing that guarantees usability it's reinventing the square wheel.

There is a second, more insidious part to this. If a decision is made to configure something via an environment variable then the entire design goal changes. Instead of coming up with a syntax that is as good as possible for the given problem, instead the goal is to produce syntax that is easy to use when typing commands on the terminal. This reduces work in the immediate short term but increases it in the medium to long term.

Why are environment variables still used?

It's the same old trifecta of why things are bad and broken:

  1. Envvars are easy to add
  2. There are existing processes that only work via envvars
  3. "This is the way we have always done it so it must be correct!"

The first explains why even new programs add configuration options via envvars (no need to add code to the command line parser, so that's a net win right?).

The second makes it seem like envvars are a normal and reasonable thing as they are so widespread.

The third makes it all but impossible to improve things on a larger scale. Now, granted, fixing these issues would be a lot of work and the transition would unearth a lot of bugs but the end result would be more readable and reliable.


from Hacker News https://ift.tt/3sHcUoJ

Software engineers make excellent CEOs, but few of them think they could do it

I recently read a somehow controversial article on why CEOs are failing software engineers. In the article, software management theorist Gene Bond argues that since business-educated CEOs only learn about financial and business management, they can't understand the creative management necessary to discover and realise new works of value.

"New value is a function of failure, not success; and, much of software engineering is about discovering new value. So, in effect, nearly everything [they] are taught as a business major or leader is seemingly incompatible with software engineering."

But what if CEOs were former software engineers? Would they still fail the software engineers they lead? Data seems to show otherwise when you know that eight of the ten most valuable technology companies have CEOs who also are engineers. Jeff Bezos, the richest man in the world, was exposed to tech and coding at a young age. Bill Gates, the second richest, fell in love with programming at 13 years old, and Mark Zuckerberg, famously kept coding Facebook while being CEO for years. Still, the majority of software engineers think they can only become CTO and have little interest in business.

Top-performing CEOs have engineering degrees

Every year since 2014, the Harvard Business Review has published an annual ranking of the best-performing CEOs in the world and, for the past three years, there have been more CEOs with engineering degrees than MBAs, including this year's number one, NVIDIA CEO Jensen Huang. One likely explanation for this trend is the increase of technology CEOs on the list, as the industry has seen exponential growth in recent years. But maybe there's something else.

First of all, software engineers know how to set up the right environment for fellow developers because, well, they've been there. They know what developers look for in a job. It's not surprising that twelve out of the twenty tech CEOs most favoured by their employees have an engineering background or coded at some point in their careers. As Stack Overflow and Trello founder Joel Sposkly puts it: "building the company where the best software developers in the world would want to work [leads] to profits as naturally as chocolate leads to chubbiness or cartoon sex in video games leads to gangland-style shooting sprees". After all, he did build two multi-million companies that considerably impacted the software ecosystem.

Joel Spolsky’s formula on how to build profitable software companies

I also believe that having a software engineering mindset, even if self-taught, allows CEOs to manage their companies very differently than financially focused peers.

Approaching business processes like programming tasks

While Microsoft valuation hardly moved during Steve Ballmer's fourteen years tenure as CEO, it grew over 200 % since Satya Nadella took over in 2014. The difference? Steve Ballmer was a sales-oriented business school drop-out, while Nadella is a former software engineer turned executive.

Microsoft stock price under Satya Nadella - CB Insights‌‌

So what does Nadella, and other engineers-turned-CEOs have in common? Well, suppose we take aside the ability to understand technology and have a long-term vision about it. In that case, I believe one of their key attributes is the ability to approach business processes like programming tasks.

Do you know what programmatic marketing, growth hacking and the lean startup have in common? They're all business methodologies that were created by engineers. They leverage logic and processes instead of intuition; they're data-driven and promote iterative experimentation. And, when you go beyond the buzzwords and watch the results, they're behind the wild success of tech companies like Dropbox and Slack (whose CEOs are, by the way, former developers).

Another trait of software engineers is their inclination to automate recurring and tedious tasks. As Bill Gates is known to say, "I always choose a lazy person to do a hard job, because a lazy person will find an easy way to do it." And software engineers are known to be lazy. So, as CEOs, they're more likely to look for scalable solutions through automation, rather than merely hiring more human beings. Some CEOs take this thinking to another level like GitLab CEO Sid Sijbrandij, who started the company's famous handbook because he didn't want to repeat himself for every batch of new hires.

What's even more interesting is when software engineers become CEOs of non-software companies. In this case, they run their firm like a software company, making software the cornerstone of their strategy, like Elon Musk with Tesla. One key component of electric automaker Tesla's success, as spotted by Nathan Furr and Jeff Dyer, is that "it introduced a new hardware and software architecture. For example, a Tesla has more software than the average vehicle and it is integrated around a single central software architecture. Although most gas-powered cars have software too, they typically have less software and operate on a different architecture making it more challenging to imitate Tesla's ability to update software and optimise vehicle performance.

Last but not least, they understand like Jeff Bezos that "failure and invention are inseparable twins." In his famous letters to shareholders, Bezos often shares that what makes Amazon successful is their ability to accept the failed experiments necessary to get to invention.

Outsized returns often come from betting against conventional wisdom, and conventional wisdom is usually right. Given a ten percent chance of a 100 times payoff, you should take that bet every time. But you’re still going to be wrong nine times out of ten [...] In business, every once in a while, when you step up to the plate, you can score 1,000 runs.

Why so few software engineers want to become CEOs

So if software engineers can become excellent CEOs, even in non-tech businesses, why so few of them make it to the top? According to a 2019 Forbes study, still, 64% of F100 CEOs had a business-related undergraduate degree. I don't think it's just about software engineers' dislike for business. I believe it's also about how few of them consider the CEO position as a career choice. They're always told that if they're interested in management, the highest possible job is CTO. When hiring software engineers for a startup job, they first think they should be CTO.

Of course, not everyone wants to start a startup, the surest way to become CEO. But with more and more tech CEOs promoted from within after technology management roles, it's a choice to consider.

Summary

  • CEOs with a background in financial and business management often fail to understand software engineers
  • Former software engineers and self-taught developers make excellent CEO
  • One of their key attributes is their capacity to approach business like programming
  • CEO is a valid career choice for software engineers and they shouldn’t be afraid to consider it if they’re attracted to the business side

Reading List

[ARTICLE] Why are CEOs failing software engineers? -  Gene Bond

[ARTICLE] Hitting the High Notes - Joel Spolsky

[ARTICLE] Lessons from Tesla’s Approach to Innovation - Nathan Furr and Jeff Dyer


from Hacker News https://ift.tt/3lLqBjp

Security Breach at US Universities

Massive security breach at US universities.

US universities have been affected by a major data breach.


A massive data breach has hit US Universities including Stanford University, University of California, University of Miami, University of Colorado Boulder, Yeshiva University, Syracuse University, and University of Maryland. Hackers have stolen terabytes of student, prospective student, and employee personal information including transcripts, financial info, mailing addresses, phone numbers, usernames, passwords and Social Security Numbers. These breaches are part of the larger Accellion FTA leak which has affected ~50 organizations. Students who applied to these colleges (or even have an account in the case of UC) are at risk of having their personal and financial information leaked publicly online including their Social Security Numbers. The hackers have sent emails to some victims. If you recieve one of these emails, do not click the attached link unless you understand how to use Tor. The hackers are holding the universities at ransom. Unless the universities pay the ransom, the hackers will continue publishing student information.

Resources

Responses from universities are in bold.

Discussion Threads

Updates

3/31/21

  • Hackers post first 1.3 GB UC and Stanford data dump on their website.
  • University of California releases a statement.
  • UC Davis releases a statement.


from Hacker News https://ift.tt/3dpTtu5

Kepler's Goat Herd: An Exact Solution for Elliptical Orbit Evolution

Donate to arXiv

Please join the Simons Foundation and our generous member organizations in supporting arXiv during our giving campaign September 23-27. 100% of your contribution will fund improvements and new initiatives to benefit arXiv's global scientific community.


from Hacker News https://ift.tt/3sGD62S

Raspberry Pi Floppy Controller Board

In this post, I create a floppy controller for my raspberry pi model 4 B.

Purpose

If there’s one criticism I hear more often than any other about the pi, it’s “I wish my Raspberry Pi had a floppy drive“. It’s really shocking that the pi doesn’t have the ubiquitous 34-pin floppy header that we all know and love. How else are you supposed to interface your Tandon TM100-2A or your Teac FD-55BR or even, for you cutting edge folks, your Sony MFP290 3.5” high density drive?

So I set along to create this much needed had, the missing link between the raspberry pi and the floppy disk drive.

Design

I’ve used the WD37C65 floppy controller IC a few times in the past, most notably as part of a floppy interface project for the RC2014 computer. I’ve previously played with the RomWBW CP/M distribution for the RC2014, and the floppy drive that’s contained as part of it. So I knew this chip reasonably well and decided to go ahead and make use of it for my raspberry pi project.

The WD37C65 is a great single-chip solution, combining the floppy controller, data separator, and control latch. It actually has three different chip selects, one for the controller, one for the DOR (disk operation register?) and one for the DCR (disk configuration register?). You can easily interface it with a plethora of vintage drives, everything from your basic 360KB floppy drive to your 1.44 MB high density drive. Yes, I’m pretty sure when working on the RC2014 I interface it to some old 8″ qume drives as well. There are several selectable data rates, and you can program the number of tracks, number of heads, number of sectors, and bytes per sector. The controller can be used with an interrupt or it can use polling. It’s a great vintage IC to use.

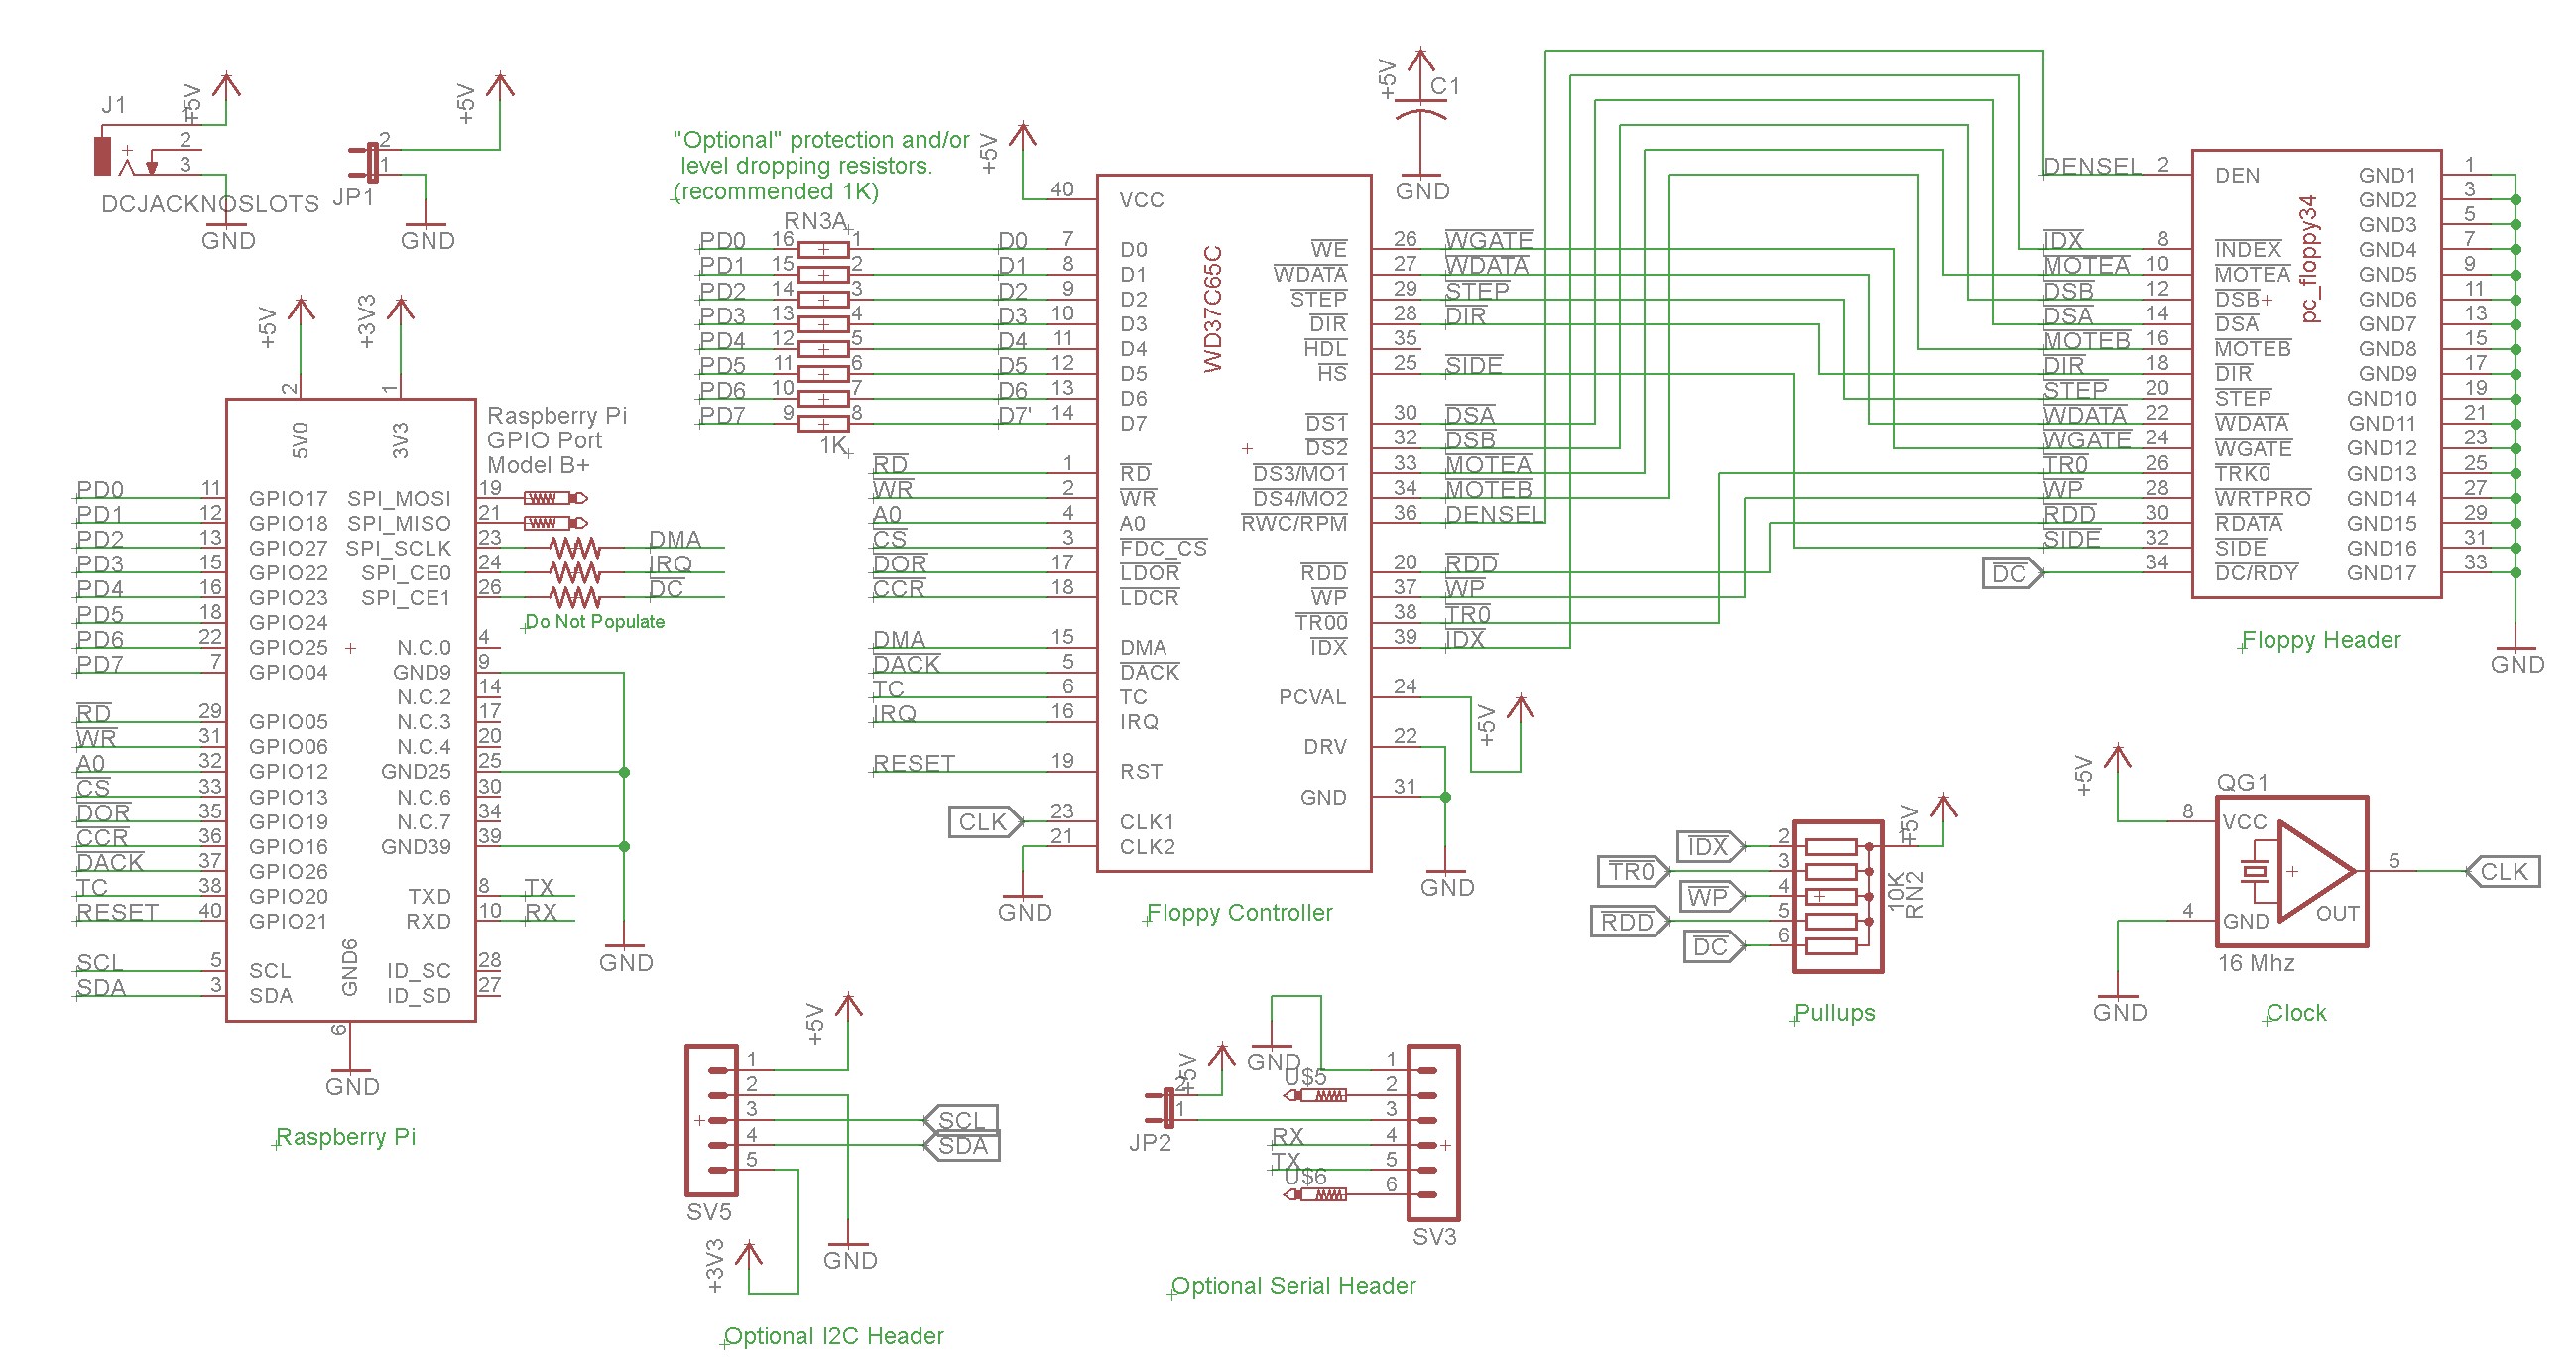
Here’s my schematic for the raspberry pi floppy controller hat:

Raspberry Pi Floppy Drive Controller Schematic

The circuit is really pretty simple, there’s only one IC, the WD37C65 controller. This IC connects directly to the 34-pin floppy header. There are also some pullups associated with about a half-dozen of the floppy drive status lines, things like the index sensor and the write protect sensor. There’s a 16 MHz oscillator that supplies the clock that the controller needs.

Most of the controller lines are interfaced directly to the pi. Lines like RD, WR, CS, A0, etc., are strictly pi-to-controller signals and both the pi and the controller are compatible even though the pi is a 3.3V device and the controller is a 5V device.

The data bus, D0-D7 is a bit more controversial. The signal levels are compatible when the pi is writing to the controller (3.3V -> 5V), but are not necessarily compatible when the controller is writing data to the pi (5V – 3.3V). When doing that sort of thing on a hobbyist-grade device I’ll often throw in some current limiting resistors. That’s the purpose of the resistor network RN3. In my video I did actually test it wired straight across, and damaged neither the pi nor the controller, though it may be risky to do so. As far as I’m aware, there isn’t a great deal of real-world studies on interfacing a pi with 5V devices, other than a lot of people saying “don’t do it”. For the next revision of this board, I’ll probably switch to using a proper level converter IC and eliminate the controversy.

I put two additional headers on the board, one for I2C and the other for serial. These fit some use cases I have planned for the board.

Implementation

Below is a picture of the completed hat:

Raspberry Pi Floppy Controller PCBOARD, Assembled

As you can see, a pretty simple one-chip hat. The 16-pin grey thing is a shunt. This is the configuration I used in the video. As I mentioned in the design section, perhaps safer here to use a DIP resistor network (isolated, not bussed) or solder in discrete resistors due to the level difference between the pi and controller IC.

The floppy header is at the bottom. If you get the shrouded header like I did, with the little cutout in the middle, it’ll keep you from pulling in your floppy cable backwards.

The stacking header for the pi protrudes out the back.

The barrel jack is optional and would allow you to supply 5VDC from a barrel jack instead of the pi’s USB-C header, if you’re a barrel jack sort of person. If you’re one of those modern USB-C people, then just use the USB-C.

Software

I wrote a user-mode driver in python, with C extensions for some of the IO functions. This presents a couple challenges:

  1. Raspbian is not a real-time OS. There’s no guarantee that your user-mode process will not be interrupted.
  2. When transferring data (i.e. read sector or write sector), the floppy controller wants every byte transferred within 13ms (standard density) or 26ms (high density). If you don’t transfer the byte in time, the controller have no place to put the next byte — the disk is spinning! — and will declare an overrun.

These two together mean that a user-mode floppy driver may have occasional overruns. No problem, when we get an overrun, we can just retry. It does have an adverse affect on performance though, and the problem is much worse when reading high density disks than when reading low density disks.

Some techniques at https://www.raspberrypi.org/forums/viewtopic.php?t=228727 can be used to mitigate the problem. By dedicating a core to the floppy driver you lose a core from general purpose use, but you also reduce the odds of Linux interrupting the floppy driver at an inopportune time. An interrupt may still occur, but less often and with less adverse affect than when sharing a core with other processes.

The ultimate solution would be to write a kernel driver. I’ve written kernel modules in the past. Perhaps it’s something I will do again, but I have no immediate plans to do so.

Demo Script

Here is a list of commands I performed in my short demo in the video:

# format the diskette
sudo python ./fdtool.py --media 360 format

# write a DOS 3.10 image to the disk
cat dos310_1.img | sudo python ./fdtool.py --realtime --pincpu 3 --media 360 --disk write

# Read the first sector and display it in the terminal
sudo python ./fdtool.py --realtime --pincpu 3 --media 360 read | hexdump -C

# Read the entire disk and display it in the terminal
sudo python ./fdtool.py --realtime --pincpu 3 --media 360 --disk read | hexdump -C

Note that the sudo goes along with the --realtime --pincpu 3 arguments and handles pinning the floppy controller to cpu core #3. It’s also necessary to add isolcpus=3 to your /boot/cmdline.txt. It will work without the sudo and without the pinning arguments, but you’ll get more interruptions and more retries needed.

Resources

Acknowledgements

  • The RomWBW CP/M assembly floppy driver, fd.asm, served as a basis for much of my learning how to program the WD37C65 and a basis for writing my python driver.
  • https://www.raspberrypi.org/forums/viewtopic.php?t=228727 contains useful information on real-time scheduling on the pi that was helpful in improving performance and reducing the retry count.


from Hacker News https://ift.tt/3uexFst

The Clubhouse clones are coming

The Clubhouse clones are coming

Image by Andrzej Nowak from Pixabay

The popularity of Clubhouse has been well documented. Anna Wiener, writer at The New Yorker, describes the app as a “drop-in audio social network that enabled the creation of voice-only chat rooms”. I think that’s a fair interpretation. For many, Clubhouse has been a unifying platform during a pandemic that often seems endless. That being said, the technical concept behind the app is relatively simple in the grand scheme of things, and other tech companies are coming up with their own renditions.

Video: “Clubhouse explained (full app walkthrough)” by CNET, YouTube.

Facebook Live Messenger Rooms

The New York Times first reported the development of Facebook Live Messenger Rooms back in February, pointing out that the tech giant is “known in Silicon Valley for being willing to clone its competitors”.

Alessandro Paluzzi, a mobile developer and self-described “leaker” noted the way Facebook’s live audio rooms product is being developed would allow for rooms that anyone on Facebook could join, and such “could be accessible from Facebook itself — meaning you would not have to switch to Messenger to join a room. When not expanded to full-screen, the room would display its title, the number of speakers, and total listeners so you could get an idea of the room’s popularity.”

Spotify / Locker Room

On Tuesday, Spotify announced it plans to acquire Betty Labs, the creators of Locker Room, a live audio app with a focus on sports.

In the next few months, Locker Room is expected to evolve into “an enhanced live audio experience for a wider range of creators and fans”.

Those new “rooms” or communities would cater to writers, musicians, songwriters, as well as podcasters.

Twitter Spaces

Twitter Spaces is a new feature within Twitter which enables users to create “rooms for voice-only chats”. A public launch is planned next month.

It’s interesting to note that Spaces will probably be available on Android devices before Clubhouse. At the time of writing, Clubhouse is only available on iOS devices through “invite only”. Alpha Exploration Co. (the app’s developer) believes it could launch an Android version around May 2021.

Instagram Live Rooms

Announced in early March, Instagram users are now be able to use “Live Rooms” to broadcast with three other people.

Instagram’s prior livestream feature allowed only two people to stream at the same time.

Slack live feature

On March 25, Protocol reported that Slack CEO Stewart Butterfield stated that the business communication platform would “soon offer a feature akin to the audio-chat app Clubhouse, which allows users to drop into rooms for conversations without requiring scheduling a meeting or initiating a call”.

Few details exist beyond those words.

Discord’s Stage Channels

Discord, the communication platform which has gained significant traction in the gaming community, is also releasing a live room feature. “Stage Channels” is available now on all platforms where Discord is available; namely: Windows, macOS, Linux, iOS, Android, and web browsers.

Prior to Stage Channels, Discord already introduced “voice channels”, which enable users in them to talk freely. In contrast, Stage Channels are designed to only allow certain people talk at once to a group. It’s important to note that not all users have the admin privileges to create those.

It’s too early to tell if the Clubhouse “clones” can be long term avenues for users, especially considering the originator is still in its infancy. But one thing is for sure: tech companies are willing to fill the “live audio seats” as soon as possible, hoping the communication format will seduce their respective audience.


from Hacker News https://ift.tt/2PsjtwW

Why hitchhiking is huge in Cuba

The air in Havana was more liquid than gas after several days of sudden rainstorms, but the oppressive humidity didn't seem to bother the Cubans standing at the city's punto amarillo (yellow points), part of the socialist island nation's countrywide hitchhiking system.

A government worker stands at the punto amarillo, asks where you're going, takes .25 Cuban pesos, (about 5 cents), and flags down a government vehicle heading that direction. The vehicles are legally required to stop if people are waiting.

"It all began with the Special Period," Yasmin Tamayo, a 32-year-old cleaning woman at a government building, told VICE News while waiting for a ride to a small village outside of Havana.

Hitchhiking, or ir con la botella (going with the bottle) as Cubans call it due to the fact that the outstretched thumb used to hail a car resembles the hand motion for taking a drink, became essential after the collapse of the Soviet Union, Cuba's "Special Period" of economic hardship.

Soviet oil, the lifeblood of Cuba's public transportation system, dried up after the Berlin Wall fell. Within a few months, once-reliable buses began to arrive several hours late, and then not at all. A few years later, the transport system that made it possible to move around in Cuba, a country where owning a private car without a license from the government only became legal in January 2014, was close to stationary.

Throughout the 1990s and halfway through the 2000s, the Cuban government adopted some peculiar means of dealing with the deteriorating public transport. One of these was nationalized hitchhiking.

"We had no choice," Tamayo said. "Government trucks were the only things on the road, and we had places to be."

Related: Cuba Is Facing a Condom Shortage

A driver steps out to fix his botero, or private taxi, in Havana. (Photo by Creede Newton)

Tamayo says that hitchhiking is largely safe. She's been using her thumb for travel regularly over the past 11 years, and asserted that while she has experienced harassment, such behavior is rare. Still, hitching rides is not her first choice for transportation. "Things got better, about 10 years ago, and I started taking city buses again," she said.

In 2005, when Cuban transport was on its last leg, Fidel Castro announced plans to revitalize the system with a dose of Yutong — Chinese buses with overhead monitors for movies, music, bathrooms, and other amenities. After Fidel ceded power to his brother Raúl, the new leader made it a priority to continue renovating the transport system.

Initially introduced to mitigate shortages in intercity travel, by 2008, Yutong buses became the blood running through the veins of Cuba's cities, replacing the camellos, large trailer-buses that could transport up to 400 people at once, and greatly reducing wait times.

But by 2009, the films had disappeared, the music fell silent, and the bathroom doors were adorned with "out of service" signs, according to Cuban daily Juventud Rebelde. And this was on the buses that were still running.

'I went back to hitchhiking a few years ago, because I prefer not to wait on the buses that are overcrowded and uncomfortable.'

"I went back to hitchhiking a few years ago, because I prefer not to wait on the buses that are overcrowded and uncomfortable," Tamayo said.

Cuban Ministry of Transport mandates that buses manufactured in China must be outfitted with American-made engines, a move many see as government mismanagement. Due to the 55-year US trade embargo of Cuba, which the socialist government estimates has cost their economy $116.8 billion, third-party businesses must purchase the motors in America, and then ship them to a third country to import them to Cuba. This results in many buses being sidelined, with repair parts coming late or not at all.

"The transportation system is screwed," Alonso Gutiérrez, a 58-year-old government mechanic, told VICE News.

A stone's throw from the impressive capital building, Gutiérrez stands in his workshop — a vacated lot that still holds the debris of a demolished building — surrounded by steam-powered trains and decrepit buses.

Related: The Cuban Government Goes After Havana's Tattoo Artists

A yellow bus sits next to steam trains awaiting restoration in Havana. (Photo by Creede Newton)

"This bus was used to transport workers to a cigar factory, before renovations started last month," he said, pointing at a large, dingy yellow bus. "Some repairs would do it good, but we don't have the parts to fix it."

The mechanic says that the trade embargo, not government mismanagement, has made it impossible to adequately repair the vehicles. "Most of our work is cosmetically restoring steam trains so they can be placed in museums. The blockade makes real repairs too expensive," he concluded.

Private transport is another solution born during the Special Period. Viazul is the premiere example. The company was started in 1996 to mitigate the problem of overcrowded buses by enticing tourists with a higher degree of comfort. But as tourism surged — visits by Americans have increased 36 percent already this year — so did prices. A round trip ticket from Havana to Camaguey, an important city 330 miles away, costs $66 — more than three times the average Cuban monthly salary of $22.

Related: What Will a Carnival Cruise to Cuba Be Like?

But more and more Cubans are taking the buses instead of tourists. Standing at Camaguey's bus station, it's common to see well-dressed Cuban citizens filing out of these private buses. Some view this as a sign that changes in Cuba are allowing many to make significant sums of money from the tourism boom, which has introduced an unprecedented level of inequality.

Iris Mariña García, an actress in the Camaguey-based Espacio Interior theater company, told VICE News that while she does enjoy advantages as a member of the artistic community, personal travel isn't one of them. "Because I'm an actress, I can express myself to a greater degree than many, without fearing repercussions," she said. "But because I don't work in the service industry or for the government, I don't have the money to travel to Havana."

Julia Cooke, an author who lived in Cuba for years and wrote a book, The Other Side of Paradise: Life in the New Cuba, which describes life in post-Fidel Havana, agrees with Mariña — but only to a point.

Cook said that there is "increased stratification along the lines of income inequality… that's fact, and it's saddening," but it's not limited to the service industry or government workers. There is a cultural elite of artists and musicians, and a remittance elite, the Cubans whose family members have moved abroad and are sending funds home.

One of the "particularly Cuban afflictions," according to Cooke, "is a lack of a steady income flow… they are often merely trying to keep as much of the money they have in any given moment as they can."

Back at the punto amarillo in Havana, Tamayo, the cleaning lady, echoed Cooke's point.

"Why am I standing here and not in a botero?" she said, using the Cuban word for one of a private taxi that had just passed. "To save money."

Follow Creede Newton on Twitter: @CreedeNewton


from Hacker News https://ift.tt/2O5lYot

Latest EmDrive tests at Dresden University shows it does not develop any thrust

Lesezeit: ca. 3 Minuten
Test and measurement setup for the “EmDrive” investigations at the TU Dresden. Copyright: M. Tajmar et al. 2021

Test and measurement setup for the “EmDrive” investigations at the TU Dresden.
Copyright: M. Tajmar et al. 2021

Dresden (Germany) – After tests in NASA laboratories had initially stirred up hope that the so-called EmDrive could represent a revolutionary, fuel-free alternative to space propulsion, the sobering final reports on the results of intensive tests and analyzes of three EmDrive variants by physicists at the Dresden University of Technology (TU Dresden) are now available. Grenzwissenschaft-Aktuell.de (GreWi) has exclusively interviewed the head of studies Prof. Dr. Martin Tajmar about the results.

Find the original German version of this article HERE

As the team led by Prof. Tajmar reported last weekend at the “Space Propulsion Conference 2020 + 1” (which was postponed due to the Corona pandemic) and published in three accompanying papers in the “Proceedings of Space Propulsion Conference 2020 + 1” (Paper 1, Paper 2, Paper 3), they had to confirm the previously discussed interim results, according to which the EmDrive does not develop the thrust previously observed by other teams (such as NASA’s Eagleworks and others). The team also confirmed that the already measured thrust forces can be explained by external effects, as they have now been proven by Tajmar and colleagues using a highly sensitive experimental and measurement setup.

On their work on the classical EmDrive Prof. Tajmar reports to GreWi-editor Andreas Müller:

“We found out that the cause of the ‘thrust’ was a thermal effect. For our tests, we used NASAs EmDrive configuration from White et al. (which was used at the Eagleworks laboratories, because it is best documented and the results were published in the ‘Journal of Propulsion and Power’.

Test and measurement setup for the “EmDrive” investigations at the TU Dresden. Copyright: M. Tajmar et al. 2021

Test and measurement setup for the “EmDrive” investigations at the TU Dresden. Copyright: M. Tajmar et al. 2021

With the aid of a new measuring scale structure and different suspension points of the same engine, we were able to reproduce apparent thrust forces similar to those measured by the  NASA-team, but also to make them disappear by means of a point suspension.

Univ.-Prof. Dr. techn. Martin Tajmar Copyright/Quelle: Christian Hüller / www.tu-dresden.de

Univ.-Prof. Dr. techn. Martin Tajmar
Copyright/Quelle: Christian Hüller / https://ift.tt/1Gve7DM

When power flows into the EmDrive, the engine warms up. This also causes the fastening elements on the scale to warp, causing the scale to move to a new zero point. We were able to prevent that in an improved structure. Our measurements refute all EmDrive claims by at least 3 orders of magnitude.”

In addition to the classic EmDrive, Tajmar’s team also analyzed the LemDrive-variation:

“This laser variant of the EmDrive is based on theoretical considerations by McCulloch. In numerous experimental set-ups, we have been able to show that both laser resonators and asymmetrical fiber coils do not show any forces that are above normal photon pressure. His theory (…we limit ourselves here to the laboratory standard and not to his astronomical claims), as well as the experiments cited by him are excluded by 4 orders of magnitude.

With both the EmDrive and the LemDrive, we have achieved a measurement accuracy that is below the photon pressure. That is, even if one of these concepts worked, it would be more effective simply to use a laser beam as a drive.”

In a third paper, the Dresden physicists then describe their research on the “Mach-Effect Thruster”:

Here we have proven that the Mach-Effect-Thruster (an idea by J. Woodward) is unfortunately a vibration artifact and also not a real thrust.”

“Looking back, those was four years of hard work. It is not trivial to carry out clean thrust measurements in this area” Prof. Tajmar concludes. “Unfortunately we weren’t able to verify any of the drive concepts, but we were able to greatly improve our measurement technology as a result, so that we can of course continue researching in this science area and perhaps discover something new.”

© grenzwissenschaft-aktuell.de


from Hacker News https://ift.tt/3rECN7r

The Key

Good artists copy. Great artists steal. Greatest artists copy, then paste.

Simplicity. Elegance. Form. Function. 

Today marks a new beginning for programmers around the world. Stack Overflow is proud to unveil our first venture into hardware, The Key

They say good artists copy, but great artists steal. They were wrong. Great artists, developers, and engineers copy. Then they paste. 

Every day, millions of innovators and creators across the globe move society and industry forward by copy-pasting code from Stack Overflow. But for too long, this process has been stuck in the past. 

Say goodbye to cramped fingers, sore wrists, and wasted movement. Say hello to The Key, a device built from the ground up to make copy-pasting code from Stack Overflow fast, painless, and fun. 

the key

Our keyboard is made of 100% machine milled plastic sourced from the rarest polyurethane plants. 

The switches underneath each keycap have been rigorously tested to ensure the optimal finger feel and smooth action. 

What happens when you press a keyboard? It clicks. Every day you’re working on a computer, you’re hearing thousands of clicks. Millions of clicks shape your experience each year. 

Our click’s volume and tone were crafted by sampling the natural wonder of song bird chirps. We run that audio data through cutting edge deep learning systems to produce a sound that is optimized to improve productivity and mood.

Each key cap has been precisely etched using industrial grade lasers normally reserved for diamond cutting and quantum fusion drives.

The Key is compatible with virtually any computing device. From a Raspberry Pi to a high end gaming rig, cutting edge copy-paste is within your reach.

For now, The Key is a stand alone device, but in the future, it will unlock an ecosystem of creativity. Our R&D department is already at work on incorporating virtual, augmented, and uncanny reality into the roadmap. 

The Key is available for pre-order now! Be the first to get yours.

Tags:

,

,


from Hacker News https://ift.tt/2QWL3D6

Expanded Testing of Video Conferencing Bandwidth Usage over 50/5 Mbps Broadband

As working from home and remote schooling remain the norm for most of us, we wanted to build on and extend our prior investigation of the bandwidth usage of popular video conferencing applications. In this post, we examine the use of video conferencing applications over a broadband service of 50 Mbps downstream and 5 Mbps upstream (“50/5 broadband service”). The goal remains the same, looking at how many simultaneous conferencing sessions can be supported on the access network using popular video conferencing applications. As before, we examined Google Meet, GoToMeeting, and Zoom, and this time we added Microsoft Teams and an examination of a mix of these applications. To avoid any appearance of endorsement of a particular conferencing application, we haven’t labeled the figures below with the specific apps under test.

We used the same network equipment from November. This includes the same cable equipment as the previous blog -- the same DOCSIS 3.0 Technicolor TC8305c gateway, supporting 8 downstream channels and 4 upstream channels, and the same CommScope E6000 cable modem termination system (CMTS).

The same laptops were also used, though this time we increased it to 10 laptops. Various laptops were used, running Windows, MacOS and Ubuntu – nothing special, just laptops that were around the lab and available for use. All used wired Ethernet connections through a switch to the modem to ensure no variables outside the control of the broadband provider would impact the speeds delivered (e.g., placement of the Wi-Fi access point, as noted below). Conference sessions were set up and parameters varied while traffic flow rates were collected over time.  Throughout testing, we ensured there was active movement in view of each laptop’s camera to more fully simulate real-world use cases.

As in the previous blog, this research doesn’t take into account the potential external factors that can affect Internet performance in a real home -- from the use of Wi-Fi, to building materials, to Wi-Fi interference, to the age and condition of the user’s connected devices -- but it does provide a helpful illustration of the baseline capabilities of a 50/5 broadband service.

As before, the broadband speeds were over-provisioned. For this testing, the 50/5 broadband service was over provisioned by 25%, a typical configuration for this service tier.

First things first: We repeated the work from November using the 25/3 broadband service. And happily, those results were re-confirmed. We felt the baseline was important to verify the setup.

Next, we moved to the 50/5 broadband service and got to work. At a high level, we found that all four conferencing solutions could support at least 10 concurrent sessions on 10 separate laptops connected to the same cable modem with the aforementioned 50/5 broadband service and with all sessions in gallery view. The quality of all 10 sessions was good and consistent throughout, with no jitter, choppiness, artifacts or other defects noticed during the sessions. Not surprisingly, with the increase in the nominal upstream speed from 3 Mbps to 5 Mbps, we were able to increase the number of concurrent sessions from the 5 we listed in the November blog to 10 sessions with the 50/5 broadband service under test.

The data presented below represents samples that were collected every 200 milliseconds over a 5-minute interval (300 seconds) using tshark (the Wireshark network analyzer).

Conferencing Application: A

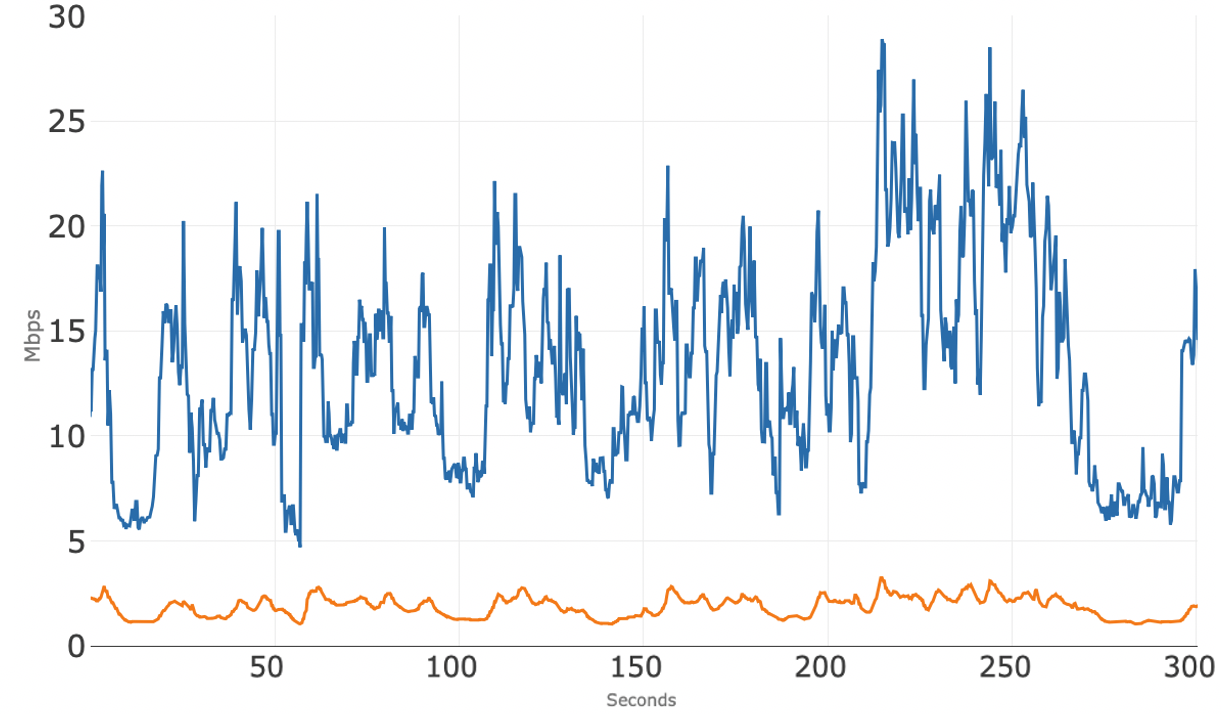
The chart below (Figure 1) shows total access network usage for the 10 concurrent sessions over 300 seconds (5 minutes) while using one of the above conferencing applications. The blue line is the total downstream usage, and the orange line is total upstream usage. Note that the total upstream usage stays around 2.5 Mbps which may be a result of running 10 concurrent sessions. Also, the downstream usage stays, on average, around 15 mbps, which leaves roughly 35 Mbps of downstream headroom for other services such as streaming video that can also use the broadband connection at the same time.

Figure 1 - App A total
 

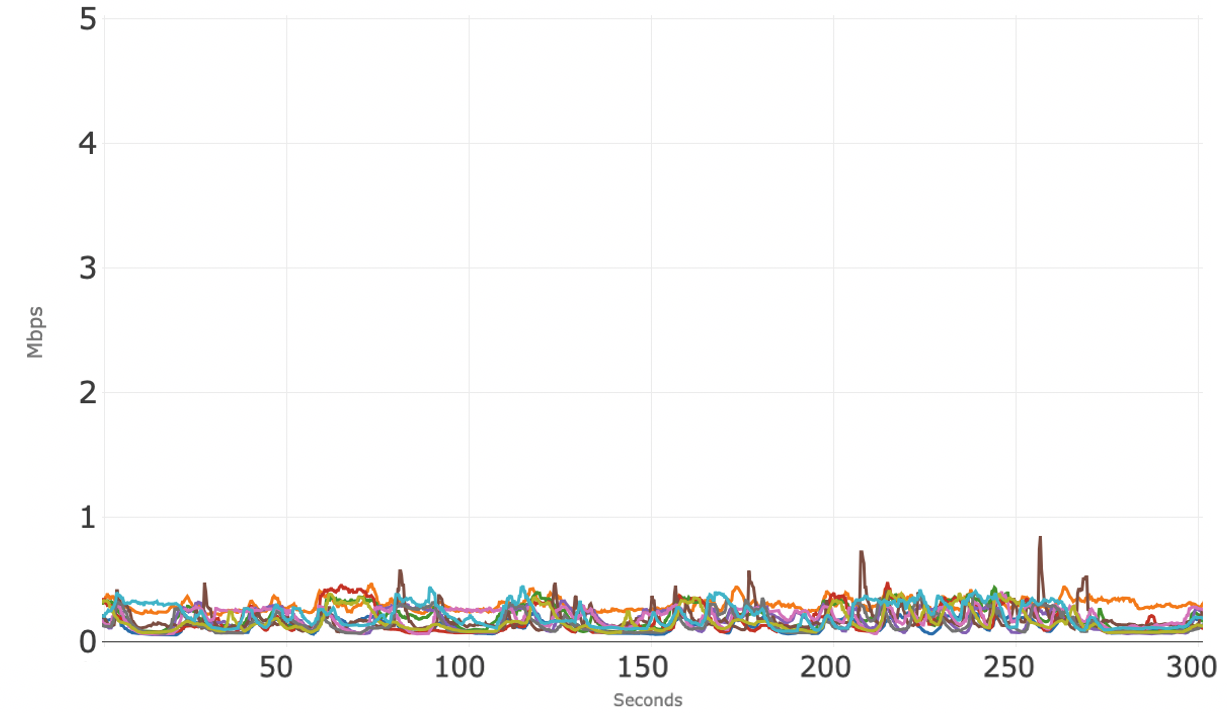
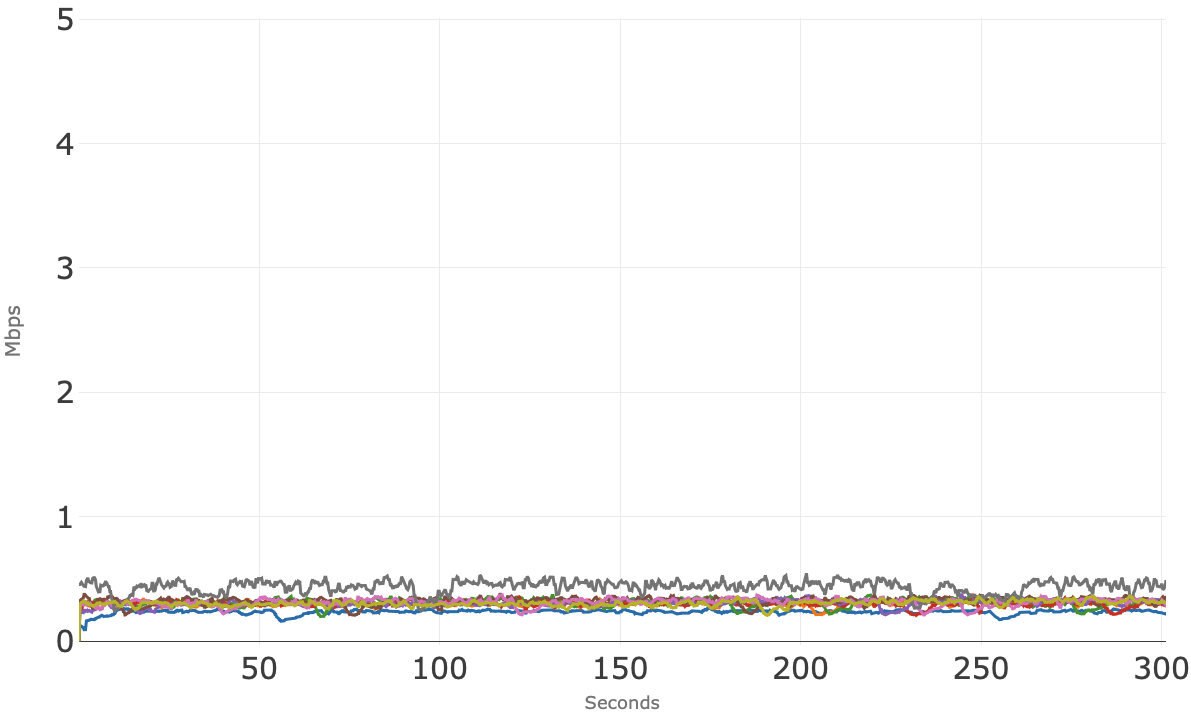
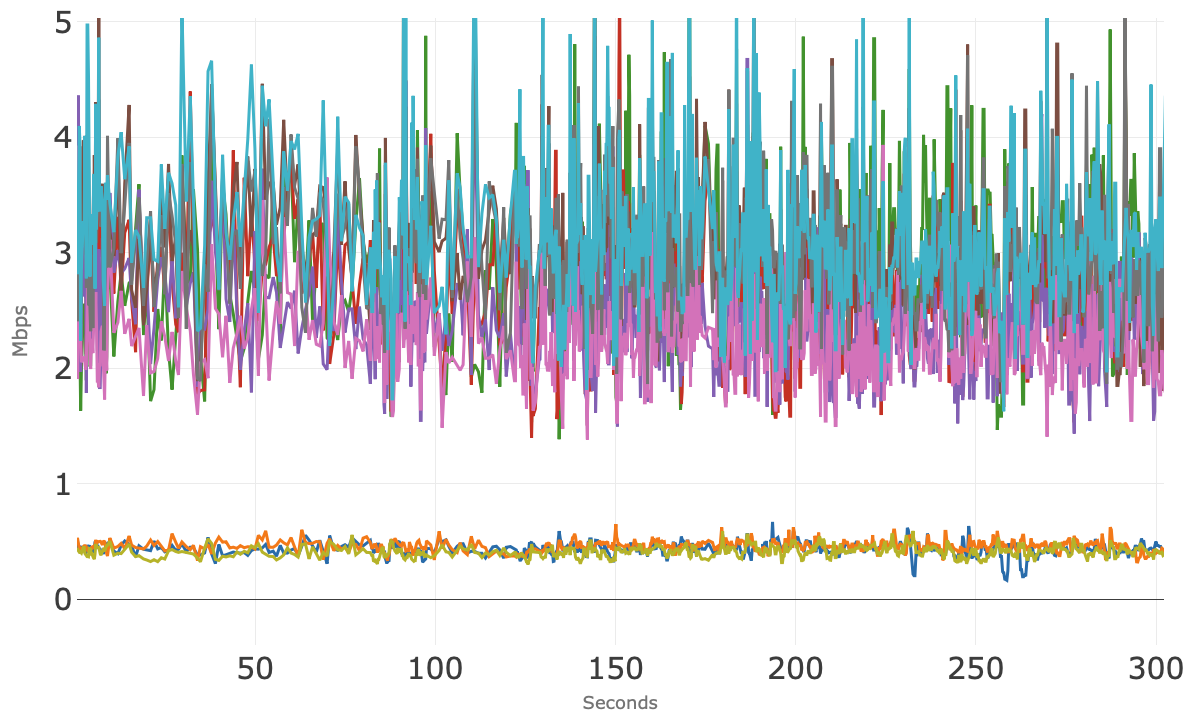
Figure 2 shows the upstream bandwidth usage of the 10 concurrent sessions and it appears that these individual sessions are competing amongst themselves for upstream bandwidth. However, all upstream sessions typically stay well below 0.5 Mbps -- these streams are all independent, with the amount of upstream bandwidth usage fluctuating over time.

Figure 2 - App A up
 

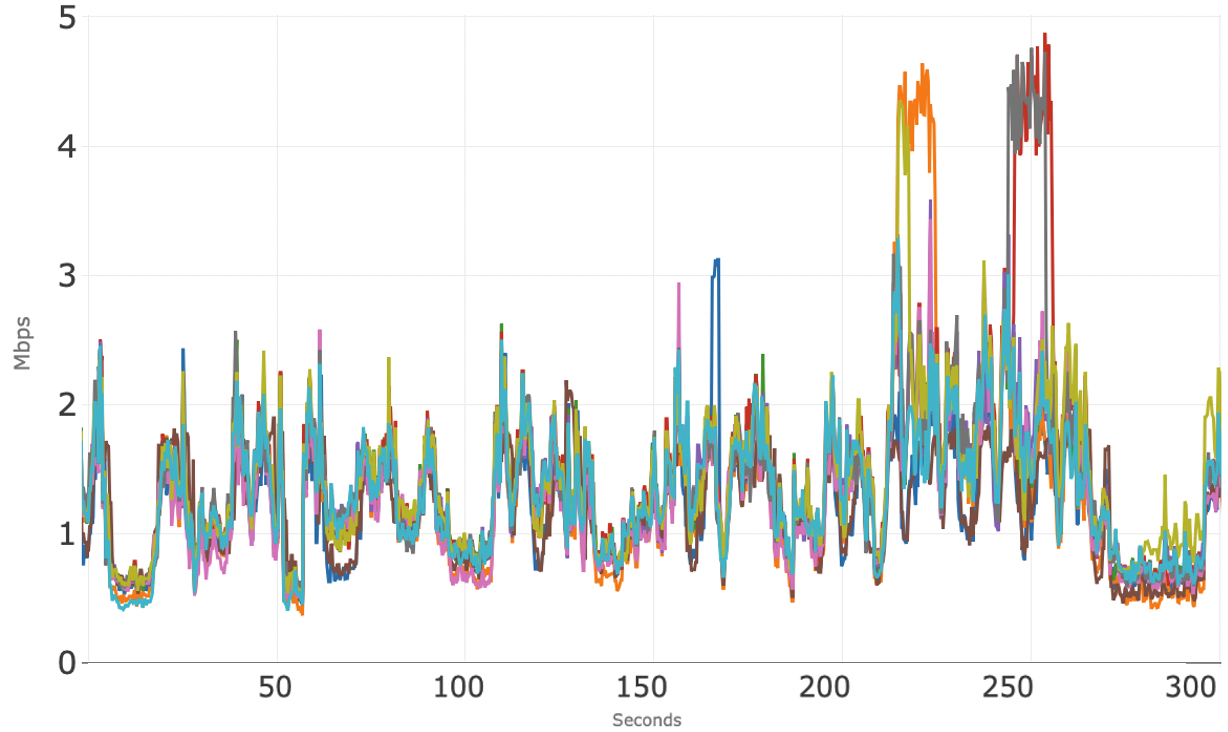
Figure 3 shows the downstream bandwidth usage for the 10 individual conference sessions. Each conference session typically uses between 1 to 2 Mbps. As previously observed with this application, there are short periods of time when some of the sessions use more downstream bandwidth than the typical 1 to 2 Mbps.

Figure 3 - App A down

Conferencing Application: B

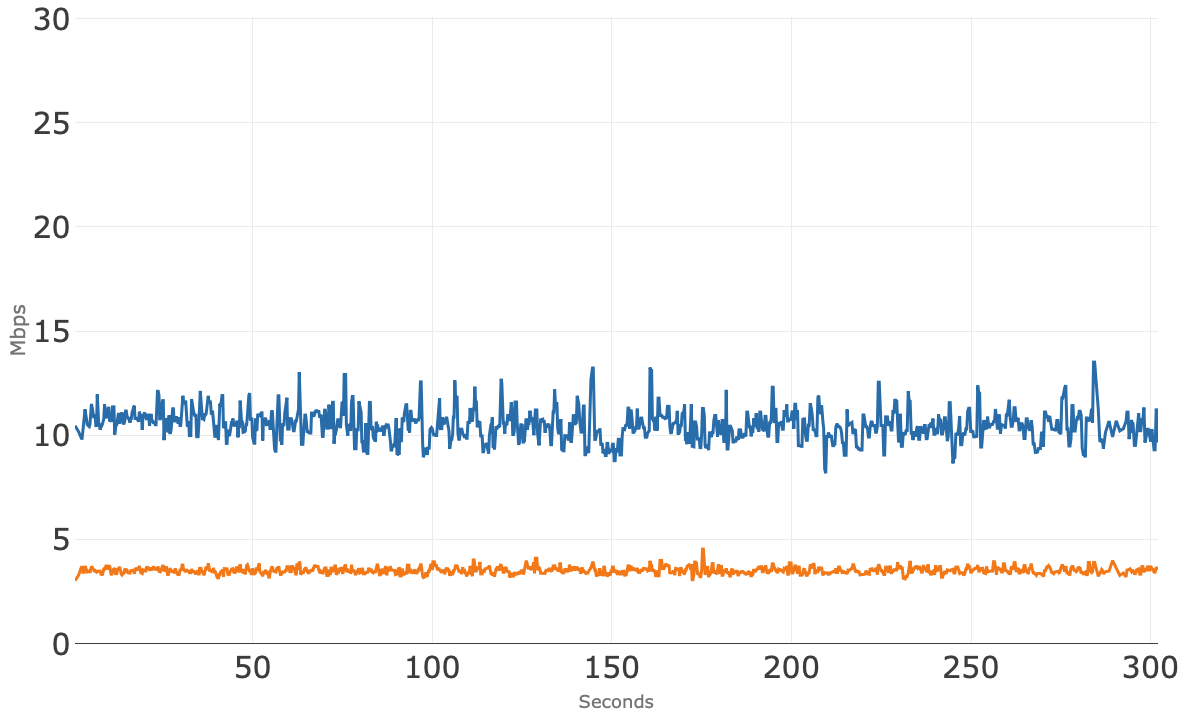
Figure 4 shows access network usage for 10 concurrent sessions over 300 seconds (5 minutes) for the second conferencing application tested. The blue line is the total downstream usage, and the orange line is total upstream usage. Note that the total upstream usage hovers around 3.5 Mbps.  The total downstream usage is very tight, right above 10 Mbps.

Figure 4 - App B total
 

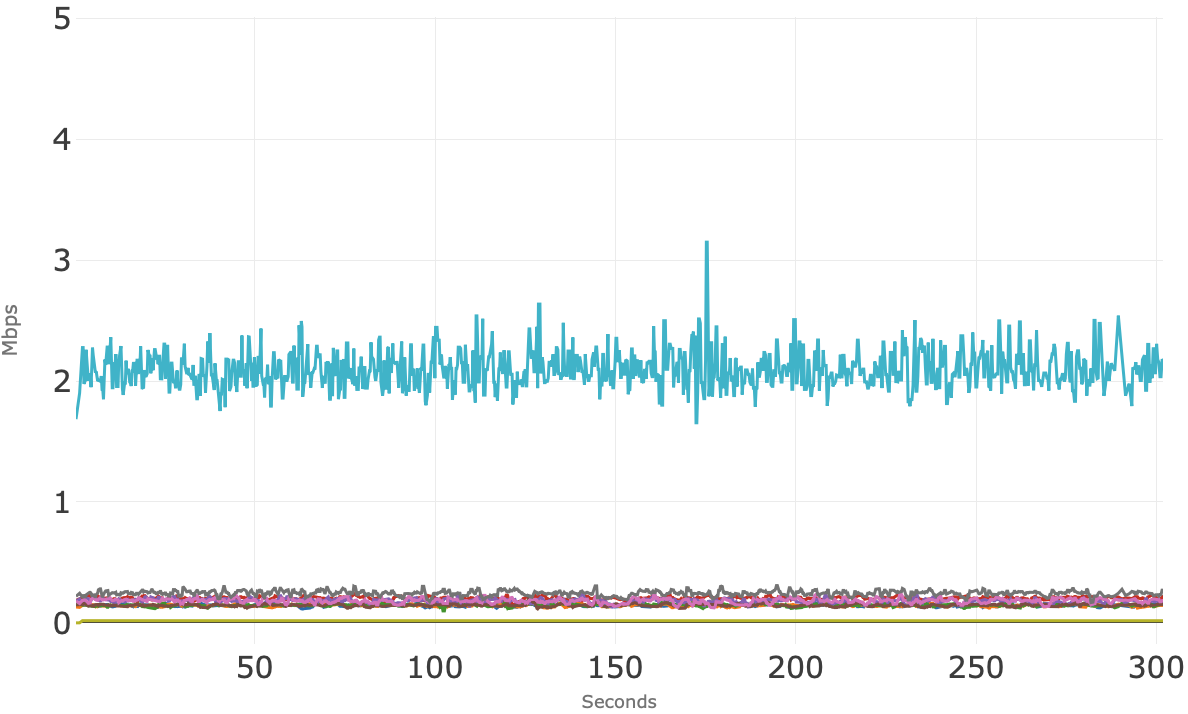
Figure 5 shows the upstream bandwidth usage of the 10 individual conference sessions where all but one session is well below 1 Mbps and that one session is right at 2 Mbps.  We don’t have an explanation for why that blue session is so much higher than the others, but it falls well within the available upstream bandwidth.

Figure 5 - App B up
 

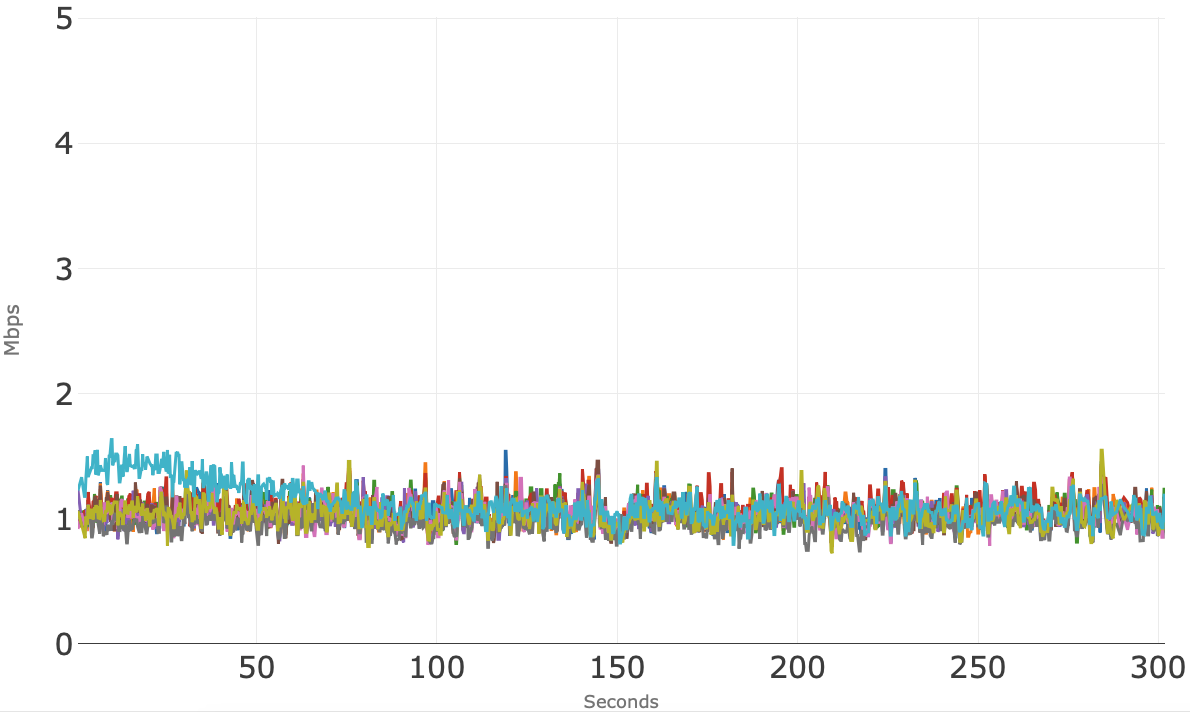
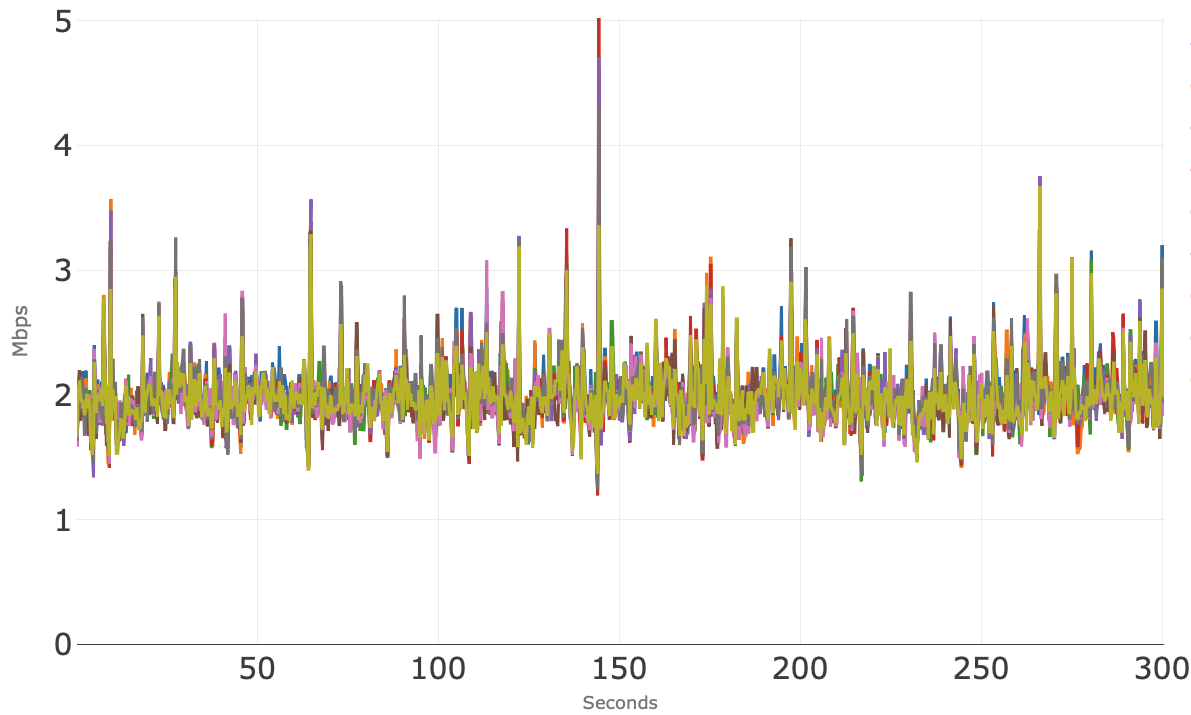
Figure 6 shows the downstream bandwidth usage for the 10 individual conference sessions clusters consistently around 1 Mbps.

Figure 6 - App B down

Conferencing Application: C

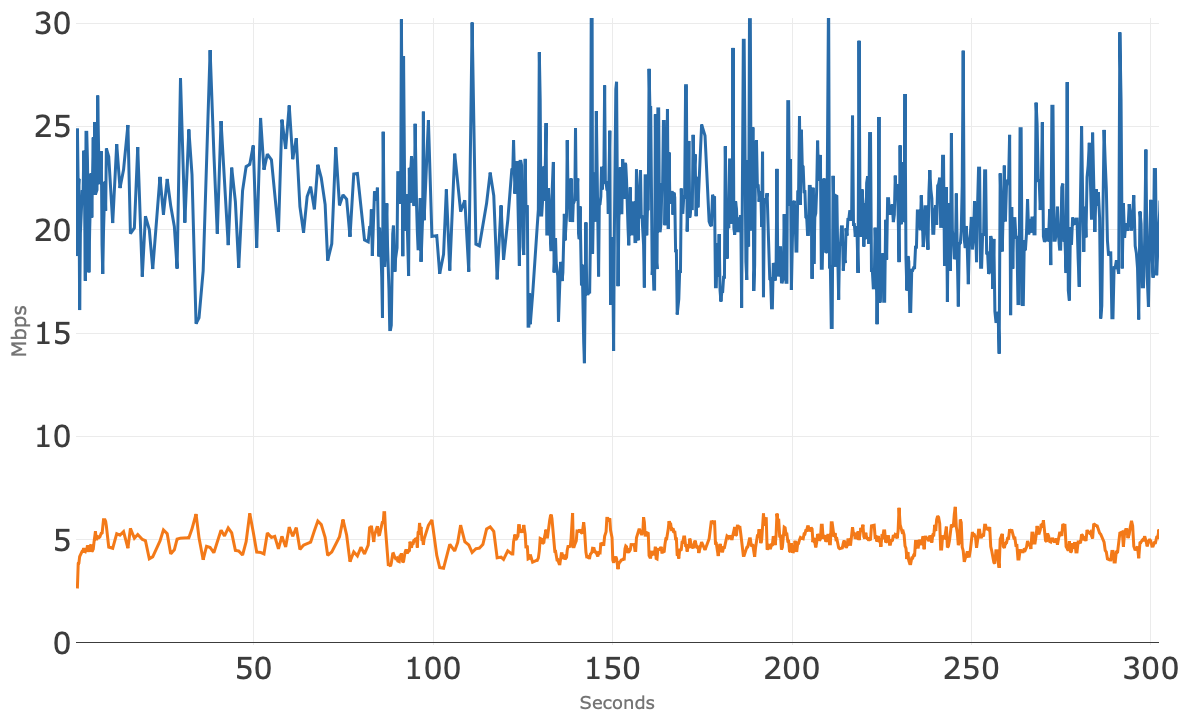
Figure 7 shows access network usage for the 10 concurrent sessions over 300 seconds (5 minutes) for the third application tested. The blue line is the total downstream usage, and the orange line is total upstream usage. Note that the total upstream usage hovers right at 3 Mbps over the 5 minutes.

Figure 7 - App C total
 

Figure 8 shows the upstream bandwidth usage of the 10 individual conference sessions where all stay well below 1 Mbps.

Figure 8 - App C up
 

Figure 9 shows the downstream bandwidth usage for the 10 individual conference sessions. These sessions appear to track each other very closely around 2 Mbps, which matches Figure 7 showing aggregate downstream usage around 20 Mbps.

Figure 9 - App C down

Conference Application: D

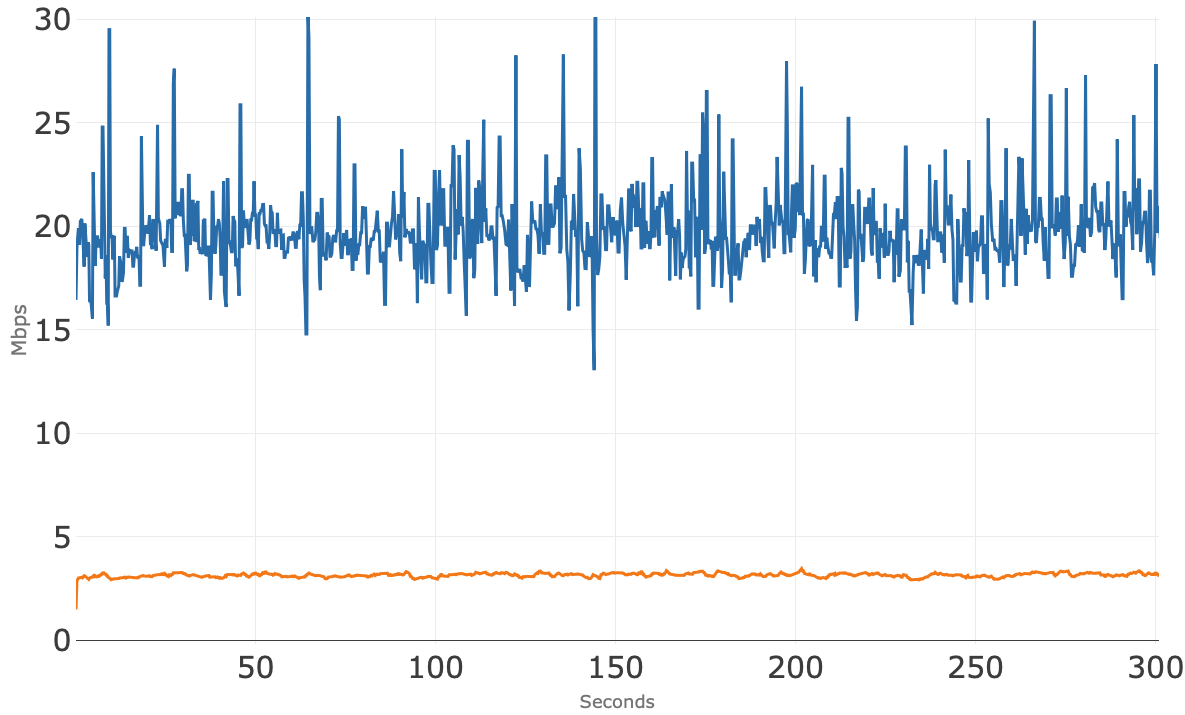
Figure 10 shows access network usage for the 10 concurrent sessions over 300 seconds (5 minutes) for the fourth application tested. The blue line is the total downstream usage, and the orange line is total upstream usage. Note that the total upstream usage hovers right at 5 Mbps over the 5 minutes, and there is no visible degradation to the conferencing sessions was observed.

Figure 10 - App D total
 

Figure 11 shows the upstream bandwidth usage of the 10 individual conference sessions, where there is some variability in bandwidth consumed per session.  One session (red) consistently uses more upstream bandwidth than the other sessions but remained well below the available upstream bandwidth.

Figure 11 - App D up
 

Figure 12 shows the downstream bandwidth usage for the 10 individual conference sessions. These sessions show two groups, with one group using less than 1 Mbps of bandwidth and the second group using consistently between 2 Mbps and 4 Mbps of bandwidth.

Figure 12 - App D down
 

Running All Four Conference Applications Simultaneously

In this section, we examine the bandwidth usage of all four conferencing applications running simultaneously. The test consists of three concurrent sessions from two of the applications and two concurrent sessions from the other two applications (once again a total of 10 conference sessions running simultaneously). The goal is to observe how the applications may interact in the scenario where members of the same household are using different conference applications at the same time.

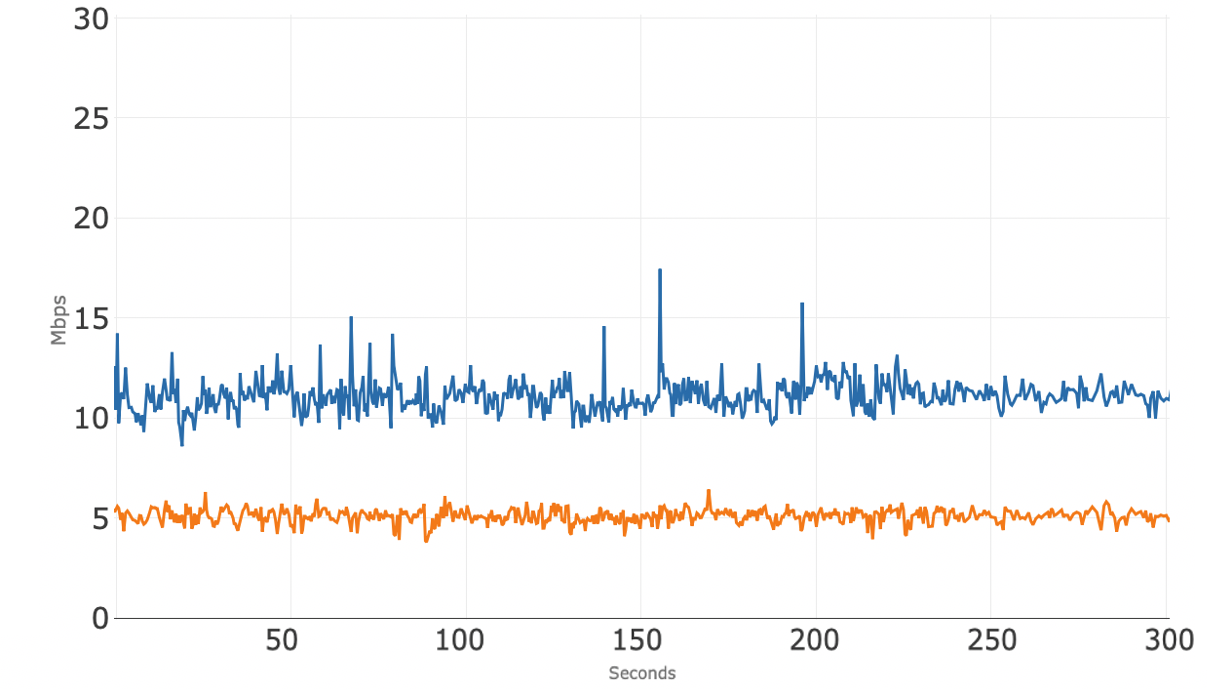
Figure 13 shows access network usage for these 10 concurrent sessions over 300 seconds (5 minutes). The blue line is the total downstream usage, and the orange line is total upstream usage. Note that the total upstream usage once again hovers around 5 Mbps without any visible degradation to the conferencing sessions, and the downstream usage is pretty tight right above 10 Mbps.

Figure 13 - all 4 total
 

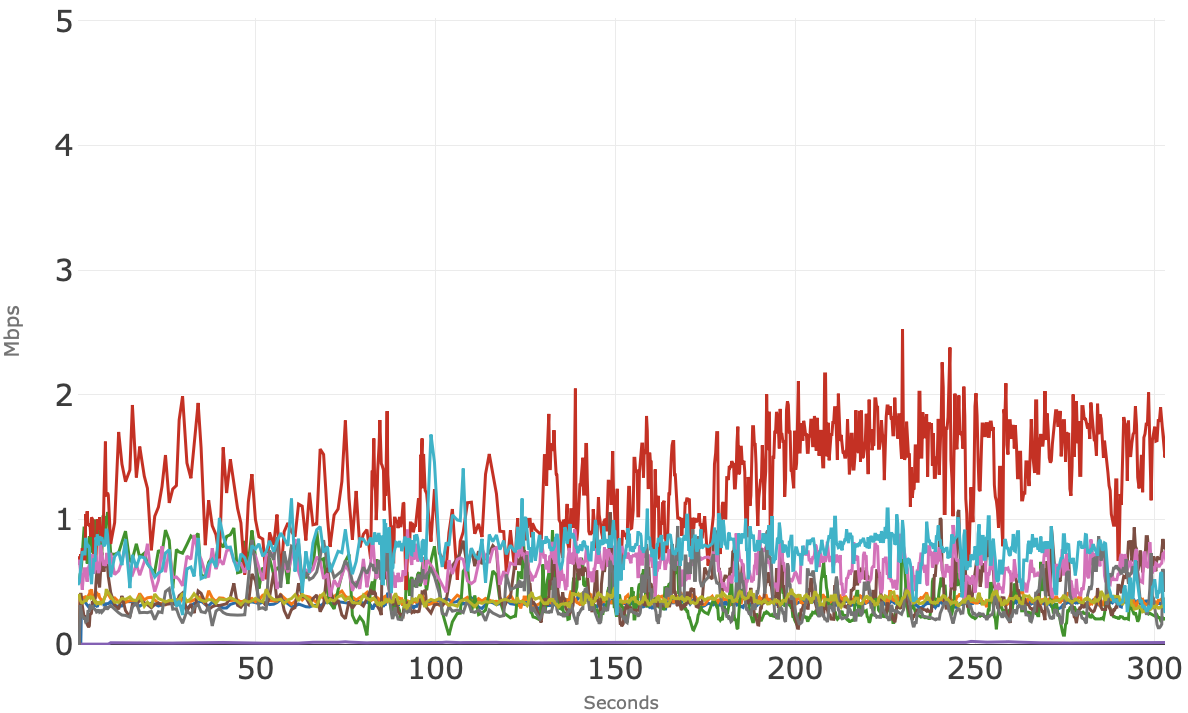
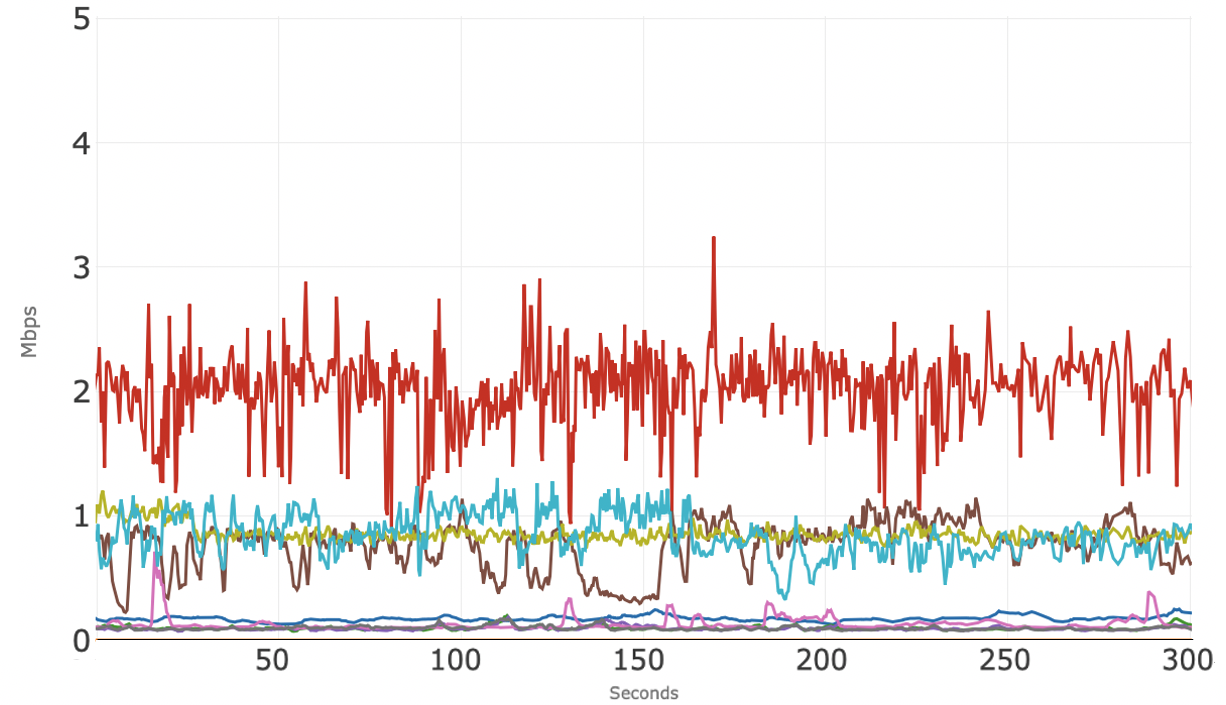
Figure 14 shows the upstream bandwidth usage of the 10 individual conference sessions where several distinct groupings of sessions are visible. There were 4 different apps running concurrently. One session (red) consumes the most upstream bandwidth at averaging around 2 Mbps, whereas the other sessions use less, and some much less.

Figure 14 - all 4 up
 

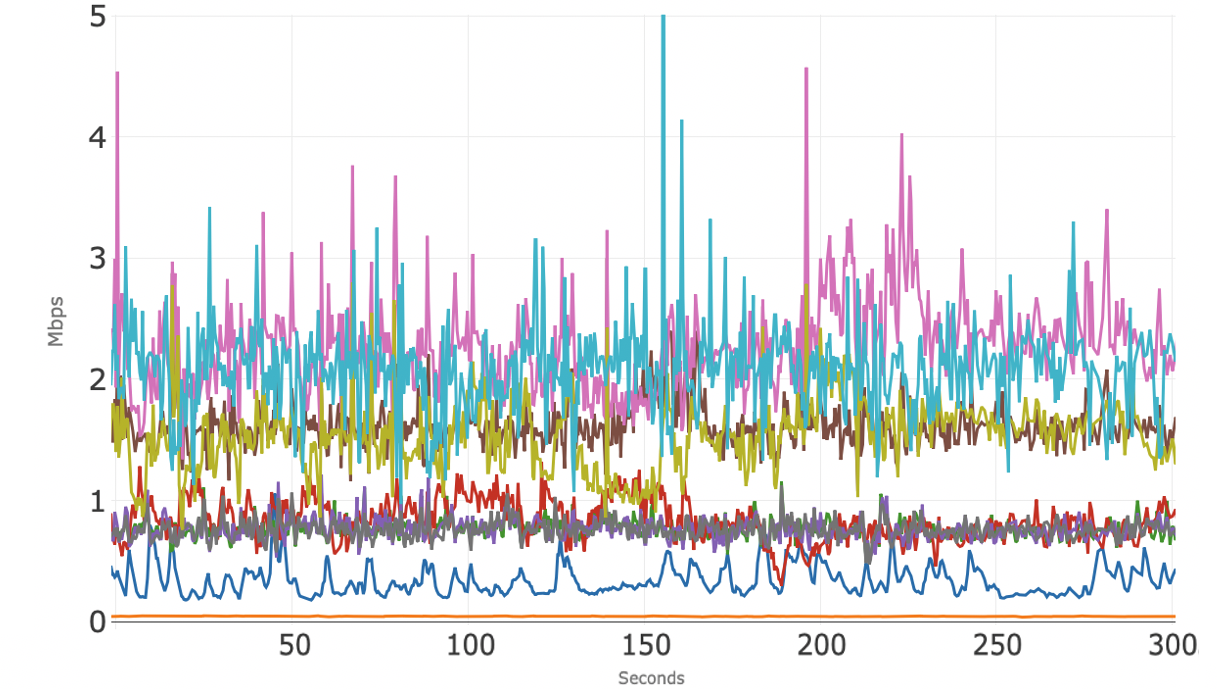
Figure 15 shows the downstream bandwidth usage for the 10 individual conference sessions across the four apps and, again, there are different clusters of sessions. Each of the four apps are following their own algorithms.

Figure 15 - all 4 down
 

In summary, with a 50/5 broadband service, each of the video-conferencing applications supported at least 10 concurrent sessions, both when using a single conferencing application and when using a mix of these four applications. In all cases, the quality of the 10 concurrent sessions was good and consistent throughout. The 5 Mbps of nominal upstream bandwidth was sufficient to support the conferencing sessions without visible degradation, and there was more than sufficient available downstream bandwidth to run other common applications, such as video streaming and web browsing, concurrently with the 10 conferencing sessions.

CABLE BROADBAND NETWORK PERFORMANCE


from Hacker News https://ift.tt/31yZNdv

India freezes ByteDance bank accounts

The war between the Indian government and ByteDance has intensified, months after the company trimmed its operations in India following the move by regulators to ban TikTok in what was at the time its largest market outside China.

According to a Reuters report, Indian regulators have frozen the bank accounts of ByteDance over alleged tax evasion, a move the company has challenged in court.

The report says the move took place in mid-March, as two of the company’s bank accounts in Citibank and HSBC were ordered blocked for alleged evasion of taxes related to online advertising dealings between ByteDance and its parent entity in Singapore, TikTok Pte Ltd.

Authorities also directed the two banks not to allow Bytedance to withdraw funds from any other bank accounts linked to its tax identification number.

ByteDance has reporedlty argued in a cuort document that its entire business had come to a standstill due to the bank freeze and that its rights to “carry free trade and business” had been violated. The report cited a source saying employee salaries and vendor payments could be affected.

Since 2016, India has imposed an ‘Equalisation Levy’ on online advertisements and related payments for provision of digital advertising space, at a rate of six per cent for non-residents that do not have a permanent establishment in India, and at two per cent on considerations received or receivable by e-commerce operators from e-commerce supply or services made or provided or facilitated to Indian residents, those who not resident in India but who undertake sale of adverts that targets Indian residents or sale of data from people resident in India.

While TikTok amassed hundreds of millions of users in India, it lost all of these after border tensions between India and China in 2020 were followed by authorities banning the app in India over "national security" concerns. 


from Hacker News https://ift.tt/2PO0mgB

Humans display a few consistent behavioral phenotypes in two player games (2016)

Abstract

Socially relevant situations that involve strategic interactions are widespread among animals and humans alike. To study these situations, theoretical and experimental research has adopted a game theoretical perspective, generating valuable insights about human behavior. However, most of the results reported so far have been obtained from a population perspective and considered one specific conflicting situation at a time. This makes it difficult to extract conclusions about the consistency of individuals’ behavior when facing different situations and to define a comprehensive classification of the strategies underlying the observed behaviors. We present the results of a lab-in-the-field experiment in which subjects face four different dyadic games, with the aim of establishing general behavioral rules dictating individuals’ actions. By analyzing our data with an unsupervised clustering algorithm, we find that all the subjects conform, with a large degree of consistency, to a limited number of behavioral phenotypes (envious, optimist, pessimist, and trustful), with only a small fraction of undefined subjects. We also discuss the possible connections to existing interpretations based on a priori theoretical approaches. Our findings provide a relevant contribution to the experimental and theoretical efforts toward the identification of basic behavioral phenotypes in a wider set of contexts without aprioristic assumptions regarding the rules or strategies behind actions. From this perspective, our work contributes to a fact-based approach to the study of human behavior in strategic situations, which could be applied to simulating societies, policy-making scenario building, and even a variety of business applications.

Keywords
  • Cooperation
  • dyadic games
  • social dilemmas
  • experiment
  • behavior
  • rationality
  • risk-aversion
  • altruism
  • cooperative phenotype

INTRODUCTION

Many situations in life entail social interactions where the parties involved behave strategically; that is, they take into consideration the anticipated responses of actors who might otherwise have an impact on an outcome of interest. Examples of these interactions include social dilemmas where individuals face a conflict between self and collective interests, which can also be seen as a conflict between rational and irrational decisions (13), as well as coordination games where all parties are rewarded for making mutually consistent decisions (4). These and related scenarios are commonly studied in economics, psychology, political science, and sociology, typically using a game theoretic framework to understand how decision-makers approach conflict and cooperation under highly simplified conditions (57).

Extensive work has shown that, when exposed to the constraints introduced in game theory designs, people are often not “rational” in the sense that they do not pursue exclusively self-interested objectives (8, 9). This is especially clear in the case of prisoner’s dilemma (PD) games, where rational choice theory predicts that players will always defect but empirical observation shows that cooperation oftentimes occurs, even in “one-shot” games where there is no expectation of future interaction among the parties involved (8, 10). These findings beg the question as to why players sometimes choose to cooperate despite incentives not to do so. Are these choices a function of a person’s identity and therefore consistent across different strategic settings? Do individuals draw from a small repertoire of responses, and if so, what are the conditions that lead them to choose one strategy over another?

Here, we attempt to shed light on these questions by focusing on a wide class of simple dyadic games that capture two important features of social interaction, namely, the temptation to free-ride and the risk associated with cooperation (8, 11, 12). All are two-person, two-action games in which participants decide simultaneously which of the two actions they will take. Following previous literature, we classify participants’ set of choices as either cooperation, which we define as a choice that promotes the general interest, or defection, a choice that serves an actor’s self-interest at the expense of others.

The games used in our study include PD (13, 14), the stag hunt (SH) (4), and the hawk-dove (15) or snowdrift (16) games (SGs). SH is a coordination game in which there is a risk in choosing the best possible option for both players: cooperating when the other party defects poses serious consequences for the cooperator, whereas the defector faces less extreme costs for noncooperation (17). SG is an anticoordination game where one is tempted to defect, but participants face the highest penalties if both players defect (18). In PD games, both tensions are present: when a player defects, the counterpart faces the worst possible situation if he or she cooperates, whereas in that case, the defector benefits more than by cooperating. We also consider the harmony game (HG), where the best individual and collective options coincide; therefore, there should be no tensions present (19).

Several theoretical perspectives have sought to explain the seemingly irrational behavior of actors during conflict and cooperation games. Perhaps most prominent among them is the theory of social value orientations (2022), which focuses on how individuals divide resources between self and others. This research avenue has found that individuals tend to fall into certain categories such as individualistic (thinking only about themselves), competitive (attempting to maximize the difference between their own and the other’s payoff), cooperative (attempting to maximize everyone’s outcome), and altruistic (sacrificing their own benefits to help others). Relatedly, social preferences theory posits that people’s utility functions often extend beyond their own material payoff and may include considerations of aggregate welfare or inequity aversion (23). Whereas theories of social orientation and social preferences assume intrinsic value differences between individuals, cognitive hierarchy theory instead assumes that players make choices on the basis of their predictions about the likely actions of other players, and as such, the true differences between individuals come not from values but rather from depth of strategic thought (24).

One way to arbitrate between existing theoretical paradigms is to use within-subject experiments, where participants are exposed to a wide variety of situations requiring strategic action. If individuals exhibit a similar logic (and corresponding behavior) in different experimental settings, this would provide a more robust empirical case for theories that argue that strategic action stems from intrinsic values or social orientation. By contrast, if participants’ strategic behavior depends on the incentive structure afforded by the social context, these findings would pose a direct challenge to the idea that social values drive strategic choices.

We therefore contribute to the literature on decision-making in three important ways. First, we expose the same participants to multiple games with different incentive structures to assess the extent to which strategies stem from stable characteristics of an individual. Second, we depart from existing paradigms by not starting from an a priori classification to analyze our experimental data. For instance, empirical studies have typically used classifications schemes that were first derived from theory, making it difficult to determine whether these classifications are the best fit for the available data. We address this issue by using an unsupervised, robust classification algorithm to identify the full set of “strategic phenotypes” that constitute the repertoire of choices among individuals in our sample. Finally, we advance research that documents the profiles of cooperative phenotypes (25) by expanding the range of human behaviors that may fall into similar types of classification. By focusing on both cooperation and defection, this approach allows us to make contributions toward a taxonomy of human behaviors (26, 27).

RESULTS

Laboratory-in-the-field experiment

We recruited 541 subjects of different ages, educational level, and social status during a fair in Barcelona (see Materials and Methods) (28). The experiment consisted of multiple rounds, in which participants were randomly assigned partners and assigned randomly chosen payoff values, allowing us to study the behavior of the same subject in a variety of dyadic games including PD, SH, SG, and HG, with different payoffs. To incentivize the experimental subjects’ decisions with real material (economic) consequences, they were informed that they would proportionally receive lottery tickets (one ticket per 40 points; the modal number of tickets earned was two) to the payoff they accumulated during the rounds of dyadic games they played. The prize in the corresponding lottery was four coupons redeemable at participating neighboring stores, worth 50 euros each. The payoff matrices shown to the participants had the following form (rows are participant’s strategies, whereas columns are those of the opponent)Embedded Image(1)

Actions C and D were coded as two randomly chosen colors in the experiment to avoid framing effects. R and P were always set to R = 10 and P = 5, whereas T and S took values T ∈ {5, 6, …, 15} and S ∈ {0, 1, …, 10}. In this way, the (T, S) plane can be divided into four quadrants, each one corresponding to a different game depending on the relative order of the payoffs: HG (S > P, R > T), SG (T > R > S > P), SH (R > T > P > S), and PD (T > R > P > S). Matrices were generated with equal probability for each point in the (T, S) plane, which was discretized as a lattice of 11 × 11 sites. Points in the boundaries between games, at the boundary of our game space, or in its center do not correspond to the four basic games previously described. However, we kept those points to add generality to our exploration, and in any event, we made sure in the analysis that the results did not change even if we removed those special games (see below). For reference, see Fig. 1 (middle) for the Nash (symmetric) equilibrium structure of each one of these games.

Fig. 1 Summary of the games used in the experiment and their equilibria.

Schema with labels to help identify each one of the games in the quadrants of the (T, S) plane (left), along with the symmetric Nash equilibria (center) and average empirical cooperation heatmaps from the 8366 game actions of the 541 subjects (right), in each cell of the (T, S) plane. The symmetric Nash equilibria (center) for each game are as follows: PD and HG have one equilibrium, given by the pure strategies D and C, respectively. SG has a stable mixed equilibrium containing both cooperators and defectors, in a proportion that depends on the specific payoffs considered. SH is a coordination game displaying two pure-strategy stable equilibria, whose bases of attraction are separated by an unstable one, again depending on the particular payoffs of the game (5, 6, 43). The fraction of cooperation is color-coded (red, full cooperation; blue, full defection).

Population-level behavior

The average level of cooperation aggregated over all games and subjects is 〈C〉 = 0.49 ± 0.01, where the error corresponds to a 95% confidence interval (we apply this rule to the rest of our results, unless otherwise specified). This is in agreement with the theoretically expected value, 〈Ctheo = 0.5, calculated by averaging over all the symmetric Nash equilibria for the (T, S) values analyzed. However, the aggregate cooperation heatmap looks very different from what would be obtained by simulating a population of players on a well-mixed scenario (compare right and central panels in Fig. 1).

On the other hand, the experimental levels of cooperation per game (excluding the boundaries between them, so the points strictly correspond to one of the four games) are as follows: 〈CPD = 0.29 ± 0.02 (Embedded Image), 〈CSG = 0.40 ± 0.02 (Embedded Image), 〈CSH = 0.46 ± 0.02 (Embedded Image), and 〈CHG = 0.80 ± 0.02 (Embedded Image). The values are considerably different from the theoretical ones in all cases, particularly for PD and HG.

Emergence of phenotypes

After looking at the behavior at the population level, we focus on the analysis of the decisions at the individual level (27). Our goal is to assess whether individuals behave in a highly idiosyncratic manner or whether, on the contrary, there are only a few “phenotypes” by which all our experimental subjects can be classified. To this aim, we characterize each subject with a four-dimensional vector where each dimension represents a subject’s average level of cooperation in each of the four quadrants in the (T, S) plane. Then, we apply an unsupervised clustering procedure, the K-means clustering algorithm (29), to group those individuals that have similar behaviors, that is, the values in their vectors are similar. Input for this algorithm (see section S4.7) is the number of clusters k, which is yet to be determined, and this algorithm groups the data in such a way that it both minimizes the dispersion within clusters and maximizes the distance among centroids of different clusters. We found that k = 5 clusters is the optimal number of groups according to the Davies-Bouldin index (see section S4.8) (30), which does not assume beforehand any specific number of types of behaviors.

The results of the clustering analysis (Fig. 2) show that there is a group that mostly cooperates in HG, a second group that cooperates in both HG and SG, and a third one that cooperates in both HG and SH. Players in the fourth group cooperate in all games, and finally, we find a small group who seems to randomly cooperate almost everywhere, with a probability of approximately 0.5.

Fig. 2 Results from the K-means clustering algorithm.

For every cluster, a column represents a player belonging to his or her corresponding cluster, whereas the four rows indicate the four average cooperation values associated with his or her (from top to bottom: cooperation in HG, SG, SH, and PD games). We color-coded the average level of cooperation for each player in each game (blue, 0.0; red, 1.0), whereas the lack of value in a particular game for a particular player is coded in white. Cluster sizes: Envious, n = 161 (30%); Pessimist, n = 113 (21%); Undefined, n = 66 (12%); Optimist, n = 110 (20%); Trustful, n = 90 (17%).

To obtain a better understanding of the behavior of these five groups, we represent the different types of behavior in a heatmap (Fig. 3) to extract characteristic behavioral rules. In this respect, it is important to note that Fig. 3 provides a complementary view of the clustering results: our clustering analysis was carried out attending only to the aggregate cooperation level per quadrant, that is, to four numbers or coordinates per subject, whereas this plot shows the average number of times the players in each group cooperated for every point in the space of games.

Fig. 3 Summary results of the different phenotypes (Optimist, Pessimist, Envious, Trustful, and Undefined) determined by the K-means clustering algorithm, plus the aggregation of all phenotypes.

For each phenotype (column), we show the word description of the behavioral rule and the corresponding inferred behavior in the whole (T, S) plane (labeled as Numerical). The fraction of cooperation is color-coded (red, full cooperation; blue, full defection). The last row (labeled as Experiment) shows the average cooperation, aggregating all the decisions taken by the subjects classified in each cluster. The fractions for each phenotype are as follows: 20% Optimist, 21% Pessimist, 30% Envious, 17% Trustful, and 12% Undefined. The very last column shows the aggregated heatmaps of cooperation for both the simulations and the experimental results. The simulation results assume that each individual plays using one and only one of the behavioral rules and respects the relative fractions of each phenotype in the population found by the algorithm. Note the agreement between aggregated experimental and aggregated numerical heatmaps (the discrepancy heatmap between them is shown in section S4.11). We report that the average difference across the entire (T, S) plane between the experiment and the phenotype aggregation is of 1.39 SD units, which represents a value inside the standard 95% confidence interval, whereas for any given phenotype, this difference averaged over the entire (T, S) plane is smaller than 2.14 SD units.

The cooperation heatmaps in Fig. 3 show that there are common characteristics of subjects classified in the same group even when looking at every point of the (T, S) plane. The first two columns in Fig. 3 display consistently different behaviors in coordination and anticoordination games, although they both act as prescribed by the Nash equlibrium in PD and HG. Both groups are amenable to a simple interpretation that links them to well-known behaviors in economic theory. Thus, the first phenotype (n = 110 or 20% of the population) cooperates wherever T < R (that is, they cooperate in the HG and in the SH and defect otherwise). By using this strategy, these subjects aim to obtain the maximum payoff without taking into account the likelihood that their counterpart will allow them to get it, in agreement with a maximax behavior (31). Accordingly, we call this first phenotype “optimists.” Conversely, we label subjects in the second phenotype “pessimists” (n = 113 or 21% of the population) because they use a maximin principle (32) to choose their actions, cooperating only when S > P (that is, in HG and SG) to ensure a best worst-case scenario. The behaviors of these two phenotypes, which can hardly be considered rational [as discussed by Colman (31)], are also associated with different degrees of risk aversion, a question that will be addressed below.

Regarding the third column in Fig. 3, it is apparent from the plots that individuals in this phenotype (n = 161 or 30% of the population) exclusively cooperate in the upper triangle of HG [that is, wherever (ST) ≥ 0]. As was the case with optimists and pessimists, this third behavior is far from being rational in a self-centered sense, in so far as players forsake the possibility of achieving the maximum payoff by playing the only Nash equilibrium in HG. In turn, these subjects seem to behave as driven by envy, status-seeking consideration, or lack of trust. By choosing D when S > P and R > T, these players prevent their counterparts from receiving more payoff than themselves even when, by doing so, they diminish their own potential payoff. The fact that competitiveness overcomes rationality as players basically attempt to ensure they receive more payoff than their opponents suggests an interpretation of the game as an assurance game (3), and accordingly, we have dubbed this phenotype “envious.”

The fourth phenotype (fourth column in Fig. 3) includes those players who cooperate in almost every round and in almost every site of the (T, S) plane (n = 90 or 17% of the population). In this case, and opposite to the previous one, we believe that these players’ behavior can be associated with trust in partners behaving in a cooperative manner. Another way of looking at trust in this context is in terms of expectations, because it has been shown that expectation of cooperation enhances cooperation in the PD (33). In any event, explaining the roots of this type of cooperative behavior in a unique manner seems to be a difficult task, and alternative explanations of cooperation on the PD involving normalized measures of greed and fear (34) or up to five simultaneous factors (35) have been advanced too. Lacking an unambiguous motivation of the observed actions of the subjects in this group, we find the name “trustful” to be an appropriate one to refer to this phenotype. Last, the unsupervised algorithm found a small fifth group of players (n = 66 or 12% of the population) who cooperate in an approximately random manner, with a probability of 0.5, in any situation. For lack of better insight into their behavior, we will hereinafter refer to this minority as “undefined.”

Remarkably, three of the phenotypes reported here (optimist, pessimist, and trustful) are of a very similar size. On the other hand, the largest one is the envious phenotype, including almost a third of the participants, whereas the undefined group, which we cannot yet consider as a bona fide phenotype because we have not found any interpretation of the corresponding subjects’ actions, is considerably smaller than all the others. In agreement with abundant experimental evidence, we have not found any purely rational phenotype: the strategies used by the four relevant groups are, to different extents, quite far from self-centered rationality. Note that ours is an across-game characterization, which does not exclude the possibility of subjects taking rational, purely self-regarding decisions when restricted to one specific game (see section S4.5).

Finally, and to shed more light on the phenotypes found above, we estimate an indirect measure of their risk aversion. To do this, we consider the number of cooperative actions in SG together with the number of defective actions in SH (over the total sum of actions in both quadrants for a given player; see section S4.5). Whereas envious, trustful, and undefined players exhibit intermediate levels of risk aversion (0.52, 0.52, and 0.54, respectively), pessimists exhibit significantly higher value (0.73), consistent with their fear of facing the worst possible outcome and their choice of the best worst-case scenario. In contrast, the optimist phenotype shows a very low risk aversion (0.32), in agreement with the fact that they aim to obtain the maximum possible payoff, taking the risk that their counterpart does not work with them toward that goal.

Robustness of phenotypes

We have carefully checked that our K-means clustering results are robust. Lacking the “ground truth” behind our data in terms of different types of individual behaviors, we must test the significance and robustness of our clustering analysis by checking its dependence on the data set itself. We studied this issue in several complementary manners. First, we applied the same algorithm to a randomized version of our data set (preserving the total number of cooperative actions in the population but destroying any correlation among the actions of any given subject), showing no significant clustering structure at all (see section S4.7 for details).

Second, we ran the K-means clustering algorithm on portions of the original data with the so-called “leave-p-out” procedure (36). This test showed that the optimum five-cluster scheme found is robust even when randomly excluding up to 55% of the players and their actions (see section S4.7 for details). Moreover, we repeated the whole analysis, discarding the first two choices made by every player, to account for excessive noise due to initial lack of experience; the results more clearly show even the same optimum at five phenotypes. See section S4.7 for a complete discussion.

Third, we tested the consistency among cluster structures found in different runs of the same algorithm for a fixed number of clusters, that is to say, how likely it is that the particular composition of individuals in the cluster scheme from one realization of the algorithm is correlated with the composition from that of a different realization. To ascertain this, we computed the normalized mutual information score MI (see section S4.9 for formal definition) (37), knowing that the comparison of two runs with exactly the same clustering composition would give a value MI = 1 (perfect correlation), and MI = 0 would correspond to a total lack of correlation between them. We ran our K-means clustering algorithm 2000 times for the optimum k = 5 clusters and paired the clustering schemes for comparison, obtaining an average normalized mutual information score of MI = 0.97 (SD, 0.03). To put these numbers in perspective, the same score for the pairwise comparison of results from 2000 realizations of the algorithm on the randomized version of the data is MI = 0.59 (SD, 0.18) (see section S4.9 for more details).

All the tests presented above provide strong support for our classification in terms of phenotypes. However, we also searched for possible dependencies of the phenotype classification on the age and gender distributions for each group (see section S4.10), and we found no significant differences among them, which hints toward a classification of behaviors (phenotypes) beyond demographic explanations.

DISCUSSION AND CONCLUSIONS

We have presented the results of a laboratory-in-the-field experiment designed to identify phenotypes, following the terminology fittingly introduced by Peysakhovich et al. (25). Our results suggest that the individual behaviors of the subjects in our population can be described by a small set of phenotypes: envious, optimist, pessimist, trustful, and a small group of individuals referred to as undefined, who play an unknown strategy. The relevance of this repertoire of phenotypes arises from the fact that it has been obtained from experiments in which subjects played a wide variety of dyadic games through an unsupervised procedure, the K-means clustering algorithm, and that it is a very robust classification. With this technique, we can go beyond correlations and assign specific individuals to specific phenotypes, instead of looking at (aggregate) population data. In this respect, the trimodal distributions of the joint cooperation probability found by Capraro et al. (38) show much resemblance to our findings, and although a direct comparison is not possible because they correspond to aggregate data, they point in the direction of a similar phenotype classification. In addition, our results contribute to the currently available evidence that people are heterogeneous, by quantifying the degree of heterogeneity, in terms of both the number of types and their relative frequency, in a specific (but broad) suite of games.

Although the robustness of our agnostic identification of phenotypes makes us confident of the relevance of the behavioral classification, and our interpretation of it is clear and plausible, it is not the only possible one. It is important to point out that connections can also be drawn to earlier attempts to classify individual behaviors. As we have mentioned previously, one theory that may also shed light on our classification is that of social value orientation (2022). Thus, the envious type may be related to the competitive behavior found in that context (although in our observation, envious people just aim at making more profit than their competitors, not necessarily minimizing their competitors’ profit); optimists could be cooperative, and trustful seem very close to altruistic. As for the pessimist phenotype, we have not been able to draw a clear relationship to the types most commonly found among social value orientations, but in any event, the similarity between the two classifications is appealing and suggests an interesting line for further research. Another alternative view on our findings arises from social preferences theory (23), where, for instance, envy can be understood as the case in which inequality that is advantageous to self yields a positive contribution to one’s utility (3942). Altruists can be viewed as subjects with concerns for social welfare (39), whereas other phenotypes are difficult to be understood in this framework, and optimists and pessimists do not seem to care about their partner’s outcome. However, other interpretations may apply to these cases: optimists could be players strongly influenced by payoff dominance a la Harsanyi and Selten (43), in the sense that these players would choose strategies associated with the best possible payoff for both. Yet, another view on this phenotype is that of team reasoning (4446), namely, individuals whose strategies maximize the collective payoff of the player pair if this strategy profile is unique. Proposals such as the cognitive hierarchy theory (24, 47) and the level-k theory (48, 49) do not seem to fit our results in so far as the best response to the undefined phenotype, which would be the zeroth level of behavior, does not match any of our behavioral classes.

Our results open the door to making relevant advances in a number of directions. For instance, they point to the independence of the phenotypic classification of age and gender. Although the lack of gender dependence may not be surprising, it would be really astonishing that small children would exhibit behaviors with similar classifications in view of the body of experimental evidence about their differences from adults (5055), and further research is needed to assess this issue in detail. As discussed also by Peysakhovich et al. (25), our research does not illuminate whether the different phenotypes are born, made, or something in between, and thus, understanding their origin would be a far-reaching result.

We believe that applying an approach similar to ours to obtain results about the cooperative phenotype (25, 38, 56) and, even better, to carry out experiments with an ample suite of games, as well as a detailed questionnaire (57), is key in future research. In this regard, it has to be noted that the relationship between our automatically identified phenotypes and theories of economic behavior yields predictions about other games: envy and expectations about the future and about other players will dictate certain behaviors in many other situations. Therefore, our classification here can be tested and refined by looking for phenotypes arising in different contexts. This could be complemented with a comparison of our unsupervised algorithm with the parametric modeling approach by Cabrales (41) or even by implementing flexible specifications to social preferences (23, 39, 40) or social value orientation (2022) to improve the understanding of our behavioral phenotypes.

Finally, our results also have implications in policy-making and real-life economic interactions. For instance, there is a large group of individuals, the envious ones (about a third of the population), that in situations such as HG fail to cooperate when they are at risk of being left with lower payoff than their counterpart. This points to the difficulty of making people understand when they face a nondilemmatic, win-win situation, and that effort must be expended to make this very clear. Other interesting subpopulations are those of the pessimist and optimist phenotypes, which together amount to approximately half of the population. These people exhibit large or small risk aversion, respectively, and use an ego-centered approach in their daily lives, thus ignoring that others can improve or harm their expected benefit with highly undesirable consequences. A final example of the hints provided by our results is the existence of an unpredictable fraction of the population (undefined) that, even being small, can have a strong influence on social interactions because its noisy behavior could lead people with more clear heuristics to mimic its erratic actions. On the other hand, the classification in terms of phenotypes (particularly if, as we show here, it comprises only a few different types) can be very useful for firms, companies, or banks interacting with people: it could be used to evaluate customers or potential ones or even employees for managerial purposes, allowing for a more efficient handling of the human resources in large organizations. This approach is also very valuable in the emergent deliberative democracy and open-government practices around the globe [including the Behavioural Insights Team (58) of the UK government, its recently established counterpart at the White House or the World Health Organization (59)]. Research following the lines presented here could lead to many innovations in these contexts.

MATERIALS AND METHODS

The experiment was conducted as a lab-in-the-field, that is, to avoid restricting ourselves to the typical samples of university undergraduate students, we took our laboratory to a festival in Barcelona and recruited subjects from the general audience (28). This setup allows, at the very least, to obtain results from a very wide age range, as was the case in a previous study where it was found that teenagers behave differently (55). All participants in the experiment signed an informed consent to participate. In agreement with the Spanish Law for Personal Data Protection, no association was ever made between their real names and the results. This procedure was checked and approved by the Viceprovost of Research of Universidad Carlos III de Madrid, the institution funding the experiment.

To equally cover the four dyadic games in our experiments, we discretized the (T, S) plane as a lattice of 11 × 11 sites. Each player was equipped with a tablet running the application of the experiment (see section S1 for technical details and section S2 for the experiment protocol). The participants were shown a brief tutorial in the tablet (see the translation of the tutorial in section S3) but were not instructed in any particular way nor with any particular goal in mind. They were informed that they had to make decisions in different conditions and against different opponents in every round. They were not informed about how many rounds of the game they were going to play. Because of practical limitations, we could only simultaneously host around 25 players, so the experiment was conducted in several sessions over a period of 2 days. In every session, all individuals played a different, randomly picked number of rounds between 13 and 18. In each round of a session, each participant was randomly assigned a different opponent and a payoff matrix corresponding to a different (T, S) point among our 11 × 11 different games. Couples and payoff matrices were randomized in each new round, and players did not know the identity of their opponents. In case there was an odd number of players or a given player was nonresponsive, the experimental software took over and made the game decision for him or her, accordingly labeling its corresponding data to discard actions in the analysis (143 actions). When the action was actually carried out by the software, the stipulation was that it repeated the previous choice of C or D with an 80% probability. In the three cases where a session had an odd number of participants, it has to be noted that no subjects played all the time against the software, because assigning of partners was randomized for every round. The total number of participants in our experiment was 541, adding up to a total of 8366 game decisions collected, with an average number of actions per (T, S) value of 69.1 (see also section S4.3).

SUPPLEMENTARY MATERIALS

Supplementary material for this article is available at http://advances.sciencemag.org/cgi/content/full/2/8/e1600451/DC1

Technical implementation of the experiment

Running the experiment

Translated transcript of the tutorial and feedback screen after each round

Other experimental results

fig. S1. System architecture.

fig. S2. Age distribution of the participants in our experiment.

fig. S3. Screenshots of the tutorial shown to participants before starting the experiment and feedback screen after a typical round of the game.

fig. S4. Fraction of cooperative actions for young (≤15 years old) and adult players (>16 years old) and relative difference between the two heatmaps: (young − adults)/adults.

fig. S5. Fraction of separate cooperative actions for males and females and relative difference between the two heatmaps: (males − females)/females.

fig. S6. Fraction of cooperative actions separated by round number: for the first 1 to 3 rounds, 4 to 10 rounds, and last 11 to 18 rounds.

fig. S7. Relative difference in the fraction of cooperation heatmaps between groups of rounds.

fig. S8. Total number of actions in each point of the (T,S) plane for all 541 participants in the experiment (the total number of game actions in the experiment adds up to 8366).

fig. S9. SEM fraction of cooperative actions in each point of the (T,S) plane for all the participants in the experiment.

fig. S10. Average fraction of cooperative actions (and SEM) among the population as a function of the round number overall (left) and separating the actions by game (right).

fig. S11. Distribution of fraction of rational actions among the 541 subjects of our experiment, when considering only their actions in HG or PD, or both.

fig. S12. Fraction of rational actions as a function of the round number for the 541 subjects, defined by their actions in the PD game and HG together (top) and independently (bottom).

fig. S13. Values of risk aversion averaged over the subjects in each phenotype.

fig. S14. Average response times (and SEM) as a function of the round number for all the participants in the experiment and separating the actions into cooperation or defection.

fig. S15. Distributions of response times for all the participants in the experiment and separating the actions into cooperation (top) and defection (bottom).

fig. S16. Testing the robustness of the results from the K-means algorithm.

fig. S17. Davies-Bouldin index as a function of the number of clusters in the partition of our data (dashed black) compared to the equivalent results for different leave-p-out analyses.

fig. S18. Average value for the normalized mutual information score, when doing pairwise comparisons of the clustering schemes from 2000 independent runs of the K-means algorithm both on the actual data and on the randomized version of the data.

fig. S19. Age distribution for the different phenotypes compared to the distribution of the whole population (black).

fig. S20. Difference between the experimental (second row) and numerical (or inferred; first row) behavioral heatmaps for each one of the phenotypes found by the K-means clustering algorithm, in units of SD.

fig. S21. Average level of cooperation over all game actions and for different values of T (in different colors).

fig. S22. Average level of cooperation as a function of (T,S) for both hypothesis and experiment.

This is an open-access article distributed under the terms of the Creative Commons Attribution-NonCommercial license, which permits use, distribution, and reproduction in any medium, so long as the resultant use is not for commercial advantage and provided the original work is properly cited.

REFERENCES AND NOTES

  1. B. Skyrms, The Stag Hunt and the Evolution of Social Structure (Cambridge Univ. Press, Cambridge, UK, 2003).

  2. K. Sigmund, The Calculus of Selfishness (Princeton Univ. Press, Princeton, NJ, 2010).

  3. H. Gintis, Game Theory Evolving: A Problem-centered Introduction to Evolutionary Game Theory (Princeton Univ. Press, Princeton, NJ, ed. 2, 2009).

  4. R. B. Myerson, Game Theory—Analysis of Conflict (Harvard Univ. Press, Cambridge, MA, 1991).

  5. C. F. Camerer, Behavioral Game Theory: Experiments in Strategic Interaction (Princeton Univ. Press, Princeton, NJ, 2003).

  6. J. H. Kagel, A. E. Roth, The Handbook of Experimental Economics (Princeton Univ. Press, Princeton, NJ, 1997).

  7. J. O. Ledyard, Public goods: A survey of experimental research, in The Handbook of Experimental Economics, J. H. Kagel, A. E. Roth, Eds. (Princeton Univ. Press, Princeton, NJ, 1997), pp. 111–194.

  8. A. Rapoport, A. M. Chammah, Prisoner’s Dilemma (University of Michigan Press, Ann Arbor, MI, 1965).

  9. J. M. Smith, Evolution and the theory of games (Cambridge Univ. Press, Cambridge, UK, 1982).

  10. R. Sugden, The Economics of Rights, Cooperation and Welfare (Palgrave Macmillan, London, UK, ed. 2, 2005).

  11. R. Cooper, Coordination Games (Cambridge Univ. Press, Cambridge, UK, 1998).

  12. J. MacQueen, Some methods for classification and analysis of multivariate observations, in Proceedings of the fifth Berkeley Symposium on Mathematical Statistics and Probability (University of California Press, Berkeley, CA, 1967), pp. 281–297.

  13. A. M. Colman, Game Theory and its Applications: In the Social and Biological Sciences (Psychology Press, Routledge, Oxford, UK, 1995).

  14. J. Von Neumann, O. Morgenstern, Theory of Games and Economic Behavior (Princeton Univ. Press, Princeton, NJ, 1944).

  15. C. Engel, L. Zhurakhovska, “When is the risk of cooperation worth taking? The prisoner’s dilemma as a game of multiple motives” (Max Planck Institute for Research on Collective Goods no. 2012/16, Bonn, 2012).

  16. D. J. C. MacKay, Information Theory, Inference, and Learning Algorithms (Cambridge Univ. Press, Cambridge, UK, ed. 2, 2003).

  17. J. C. Harsanyi, R. Selten, A General Theory of Equilibrium Selection in Games (Massachusetts Institute of Technology Press, Cambridge, MA, 1988).

Acknowledgments: We thank P. Brañas-Garza, A. Cabrales, A. Espín, A. Hockenberry, and A. Pah, as well as our two anonymous reviewers, for their useful comments. We thank K. Gaughan for his thorough grammar and editing suggestions. We also acknowledge the participation of 541 anonymous volunteers who made this research possible. We are indebted to the BarcelonaLab program through the Citizen Science Office promoted by the Direction of Creativity and Innovation of the Institute of Culture of the Barcelona City Council led by I. Garriga for their help and support for setting up the experiment at the Dau Barcelona Festival at Fabra i Coats. We specially want to thank I.Bonhoure, O. Marín from Outliers, N. Fernández, C. Segura, C. Payrató, and P. Lorente for all the logistics in making the experiment possible and to O. Comas (director of the DAU) for giving us this opportunity. Funding: This work was partially supported by Mineco (Spain) through grants FIS2013-47532-C3-1-P (to J.D.), FIS2013-47532-C3-2-P (to J.P.), FIS2012-38266-C02-01 (to J.G.-G.), and FIS2011-25167 (to J.G.-G. and Y.M.); by Comunidad de Aragón (Spain) through the Excellence Group of Non Linear and Statistical Physics (FENOL) (to C.G.-L., J.G.-G., and Y.M.); by Generalitat de Catalunya (Spain) through Complexity Lab Barcelona (contract no. 2014 SGR 608; to J.P. and M.G.-R.) and through Secretaria d’Universitats i Recerca (contract no. 2013 DI 49; to J.D. and J.V.); and by the European Union through Future and Emerging Technologies FET Proactive Project MULTIPLEX (Multilevel Complex Networks and Systems) (contract no. 317532; to Y.M., J.G.-G., and J.P.-C.) and FET Proactive Project DOLFINS (Distributed Global Financial Systems for Society) (contract no. 640772; to C.G.-L., Y.M., and A.S.). Author contributions: J.P., Y.M., and A.S. conceived the original idea for the experiment; J.P.-C., C.G.-L., J.V., J.G.-G., J.P., Y.M., J.D., and AS contributed to the final experimental setup; J.V., .J.D., and J.P.-C. wrote the software interface for the experiment; J.P.-C., M.G.-R., C.G.-L., J.G.-G., J.P., Y.M., and J.D. carried out the experiments; J.P.-C., M.G.-R., C.G.-L., and J.G.-G. analyzed the data; J.P.C., M.G.-R., C.G.-L., J.G.-G., J.P., Y.M., J.D., and A.S. discussed the analysis results; and J.P.-C., M.G.-R., C.G.-L., J.V., J.G.-G., J.P., Y.M., J.D., and A.S. wrote the paper. Competing interests: The authors declare that they have no competing interests. Data and materials availability: All data needed to evaluate the conclusions in the paper are present in the paper and/or the Supplementary Materials. Additional data related to this paper may be requested from the authors.


from Hacker News https://ift.tt/3wb20K1